- Matplotlib 基礎
- Matplotlib - 首頁
- Matplotlib - 簡介
- Matplotlib - 與 Seaborn 的比較
- Matplotlib - 環境搭建
- Matplotlib - Anaconda 發行版
- Matplotlib - Jupyter Notebook
- Matplotlib - Pyplot API
- Matplotlib - 簡單繪圖
- Matplotlib - 儲存圖形
- Matplotlib - 標記
- Matplotlib - 圖形
- Matplotlib - 風格
- Matplotlib - 圖例
- Matplotlib - 顏色
- Matplotlib - 顏色圖
- Matplotlib - 顏色圖歸一化
- Matplotlib - 選擇顏色圖
- Matplotlib - 顏色條
- Matplotlib - 文字
- Matplotlib - 文字屬性
- Matplotlib - 子圖示題
- Matplotlib - 圖片
- Matplotlib - 圖片蒙版
- Matplotlib - 註釋
- Matplotlib - 箭頭
- Matplotlib - 字型
- Matplotlib - 什麼是字型?
- 全域性設定字型屬性
- Matplotlib - 字型索引
- Matplotlib - 字型屬性
- Matplotlib - 比例尺
- Matplotlib - 線性與對數比例尺
- Matplotlib - 對稱對數與Logit比例尺
- Matplotlib - LaTeX
- Matplotlib - 什麼是LaTeX?
- Matplotlib - LaTeX 用於數學表示式
- Matplotlib - 在註釋中使用LaTeX文字格式
- Matplotlib - PostScript
- 啟用註釋中的LaTeX渲染
- Matplotlib - 數學表示式
- Matplotlib - 動畫
- Matplotlib - 繪圖元素
- Matplotlib - 使用Cycler進行樣式設定
- Matplotlib - 路徑
- Matplotlib - 路徑效果
- Matplotlib - 變換
- Matplotlib - 刻度和刻度標籤
- Matplotlib - 弧度刻度
- Matplotlib - 日期刻度
- Matplotlib - 刻度格式化器
- Matplotlib - 刻度定位器
- Matplotlib - 基本單位
- Matplotlib - 自動縮放
- Matplotlib - 反轉座標軸
- Matplotlib - 對數座標軸
- Matplotlib - Symlog
- Matplotlib - 單位處理
- Matplotlib - 帶單位的橢圓
- Matplotlib - 脊柱
- Matplotlib - 座標軸範圍
- Matplotlib - 座標軸比例尺
- Matplotlib - 座標軸刻度
- Matplotlib - 座標軸格式化
- Matplotlib - Axes 類
- Matplotlib - 雙座標軸
- Matplotlib - Figure 類
- Matplotlib - 多圖
- Matplotlib - 網格
- Matplotlib - 面向物件介面
- Matplotlib - PyLab 模組
- Matplotlib - subplots() 函式
- Matplotlib - subplot2grid() 函式
- Matplotlib - 錨定繪圖元素
- Matplotlib - 手動等高線
- Matplotlib - 座標報告
- Matplotlib - AGG 濾鏡
- Matplotlib - 帶狀框圖
- Matplotlib - 填充螺旋線
- Matplotlib - findobj 演示
- Matplotlib - 超連結
- Matplotlib - 圖片縮圖
- Matplotlib - 使用關鍵字繪圖
- Matplotlib - 建立Logo
- Matplotlib - 多頁PDF
- Matplotlib - 多程序
- Matplotlib - 列印標準輸出
- Matplotlib - 複合路徑
- Matplotlib - Sankey 類
- Matplotlib - MRI 與 EEG
- Matplotlib - 樣式表
- Matplotlib - 背景顏色
- Matplotlib - Basemap
- Matplotlib 事件處理
- Matplotlib - 事件處理
- Matplotlib - 關閉事件
- Matplotlib - 滑鼠移動
- Matplotlib - 點選事件
- Matplotlib - 滾動事件
- Matplotlib - 按鍵事件
- Matplotlib - 選擇事件
- Matplotlib - 透視鏡
- Matplotlib - 路徑編輯器
- Matplotlib - 多邊形編輯器
- Matplotlib - 定時器
- Matplotlib - viewlims
- Matplotlib - 縮放視窗
- Matplotlib 小部件
- Matplotlib - 游標小部件
- Matplotlib - 帶註釋的游標
- Matplotlib - 按鈕小部件
- Matplotlib - 複選框
- Matplotlib - 套索選擇器
- Matplotlib - 選單小部件
- Matplotlib - 滑鼠游標
- Matplotlib - 多游標
- Matplotlib - 多邊形選擇器
- Matplotlib - 單選按鈕
- Matplotlib - RangeSlider
- Matplotlib - 矩形選擇器
- Matplotlib - 橢圓選擇器
- Matplotlib - 滑塊小部件
- Matplotlib - 區間選擇器
- Matplotlib - 文字框
- Matplotlib 繪圖
- Matplotlib - 條形圖
- Matplotlib - 直方圖
- Matplotlib - 餅圖
- Matplotlib - 散點圖
- Matplotlib - 箱線圖
- Matplotlib - 小提琴圖
- Matplotlib - 等高線圖
- Matplotlib - 3D 繪圖
- Matplotlib - 3D 等高線
- Matplotlib - 3D 線框圖
- Matplotlib - 3D 表面圖
- Matplotlib - 矢羽圖
- Matplotlib 有用資源
- Matplotlib - 快速指南
- Matplotlib - 有用資源
- Matplotlib - 討論
Matplotlib - 文字處理
Matplotlib 具有廣泛的文字支援,包括對數學表示式的支援,TrueType 對光柵和向量輸出的支援,任意旋轉的換行分隔文字以及 Unicode 支援。Matplotlib 包含自己的 matplotlib.font_manager,它實現了一個跨平臺、符合 W3C 標準的字型查詢演算法。
使用者可以對文字屬性(字型大小、字型粗細、文字位置和顏色等)進行大量控制。Matplotlib 實現大量的 TeX 數學符號和命令。
以下命令用於在 Pyplot 介面中建立文字:
| text | 在 Axes 的任意位置新增文字。 |
| annotate | 在 Axes 的任意位置添加註釋,可選帶箭頭。 |
| xlabel | 為 Axes 的 x 軸新增標籤。 |
| ylabel | 為 Axes 的 y 軸新增標籤。 |
| title | 為 Axes 新增標題。 |
| figtext | 在 Figure 的任意位置新增文字。 |
| suptitle | 為 Figure 新增標題。 |
所有這些函式都會建立一個並返回一個matplotlib.text.Text() 例項。
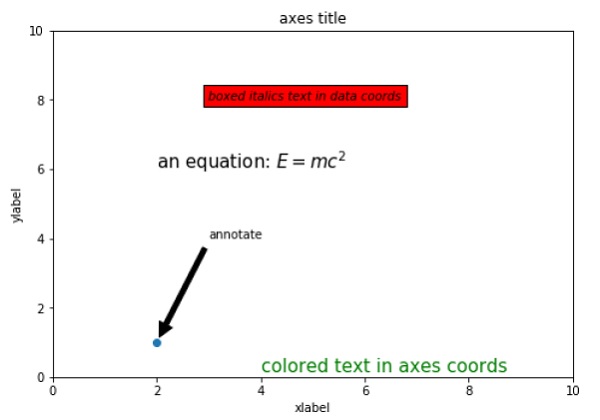
以下指令碼演示了上述某些函式的使用:
import matplotlib.pyplot as plt
fig = plt.figure()

ax = fig.add_axes([0,0,1,1])

ax.set_title('axes title')
ax.set_xlabel('xlabel')
ax.set_ylabel('ylabel')
ax.text(3, 8, 'boxed italics text in data coords', style='italic',
bbox = {'facecolor': 'red'})
ax.text(2, 6, r'an equation: $E = mc^2$', fontsize = 15)
ax.text(4, 0.05, 'colored text in axes coords',
verticalalignment = 'bottom', color = 'green', fontsize = 15)
ax.plot([2], [1], 'o')
ax.annotate('annotate', xy = (2, 1), xytext = (3, 4),
arrowprops = dict(facecolor = 'black', shrink = 0.05))
ax.axis([0, 10, 0, 10])
plt.show()
以上程式碼將生成以下輸出:
廣告