- Matplotlib 基礎
- Matplotlib - 首頁
- Matplotlib - 簡介
- Matplotlib - 與 Seaborn 的比較
- Matplotlib - 環境配置
- Matplotlib - Anaconda 發行版
- Matplotlib - Jupyter Notebook
- Matplotlib - Pyplot API
- Matplotlib - 簡單繪圖
- Matplotlib - 儲存圖形
- Matplotlib - 標記
- Matplotlib - 圖形
- Matplotlib - 樣式
- Matplotlib - 圖例
- Matplotlib - 顏色
- Matplotlib - 顏色圖
- Matplotlib - 顏色圖歸一化
- Matplotlib - 選擇顏色圖
- Matplotlib - 顏色條
- Matplotlib - 文字
- Matplotlib - 文字屬性
- Matplotlib - 子圖示題
- Matplotlib - 圖片
- Matplotlib - 圖片蒙版
- Matplotlib - 註釋
- Matplotlib - 箭頭
- Matplotlib - 字型
- Matplotlib - 什麼是字型?
- 全域性設定字型屬性
- Matplotlib - 字型索引
- Matplotlib - 字型屬性
- Matplotlib - 刻度
- Matplotlib - 線性與對數刻度
- Matplotlib - 對稱對數和Logit刻度
- Matplotlib - LaTeX
- Matplotlib - 什麼是LaTeX?
- Matplotlib - LaTeX 用於數學表示式
- Matplotlib - 在註釋中使用LaTeX文字格式
- Matplotlib - PostScript
- 在註釋中啟用LaTeX渲染
- Matplotlib - 數學表示式
- Matplotlib - 動畫
- Matplotlib - 繪圖元素
- Matplotlib - 使用Cycler進行樣式設定
- Matplotlib - 路徑
- Matplotlib - 路徑效果
- Matplotlib - 變換
- Matplotlib - 刻度和刻度標籤
- Matplotlib - 弧度刻度
- Matplotlib - 日期刻度
- Matplotlib - 刻度格式化器
- Matplotlib - 刻度定位器
- Matplotlib - 基本單位
- Matplotlib - 自動縮放
- Matplotlib - 反轉座標軸
- Matplotlib - 對數座標軸
- Matplotlib - Symlog
- Matplotlib - 單位處理
- Matplotlib - 帶單位的橢圓
- Matplotlib - 脊柱
- Matplotlib - 座標軸範圍
- Matplotlib - 座標軸刻度
- Matplotlib - 座標軸刻度
- Matplotlib - 格式化座標軸
- Matplotlib - Axes 類
- Matplotlib - 雙座標軸
- Matplotlib - Figure 類
- Matplotlib - 多圖
- Matplotlib - 網格
- Matplotlib - 面向物件介面
- Matplotlib - PyLab 模組
- Matplotlib - subplots() 函式
- Matplotlib - subplot2grid() 函式
- Matplotlib - 錨定繪圖元素
- Matplotlib - 手動等高線
- Matplotlib - 座標報告
- Matplotlib - AGG 濾鏡
- Matplotlib - 稜柱盒
- Matplotlib - 填充螺旋線
- Matplotlib - findobj 演示
- Matplotlib - 超連結
- Matplotlib - 圖片縮圖
- Matplotlib - 使用關鍵字繪圖
- Matplotlib - 建立Logo
- Matplotlib - 多頁PDF
- Matplotlib - 多程序
- Matplotlib - 列印標準輸出
- Matplotlib - 複合路徑
- Matplotlib - Sankey 類
- Matplotlib - MRI 與 EEG
- Matplotlib - 樣式表
- Matplotlib - 背景顏色
- Matplotlib - Basemap
- Matplotlib 事件處理
- Matplotlib - 事件處理
- Matplotlib - 關閉事件
- Matplotlib - 滑鼠移動
- Matplotlib - 點選事件
- Matplotlib - 滾動事件
- Matplotlib - 按鍵事件
- Matplotlib - 選擇事件
- Matplotlib - 透視鏡
- Matplotlib - 路徑編輯器
- Matplotlib - 多邊形編輯器
- Matplotlib - 定時器
- Matplotlib - Viewlims
- Matplotlib - 縮放視窗
- Matplotlib 小部件
- Matplotlib - 游標小部件
- Matplotlib - 帶註釋的游標
- Matplotlib - 按鈕小部件
- Matplotlib - 複選框
- Matplotlib - 套索選擇器
- Matplotlib - 選單小部件
- Matplotlib - 滑鼠游標
- Matplotlib - 多游標
- Matplotlib - 多邊形選擇器
- Matplotlib - 單選按鈕
- Matplotlib - 範圍滑塊
- Matplotlib - 矩形選擇器
- Matplotlib - 橢圓選擇器
- Matplotlib - 滑塊小部件
- Matplotlib - 跨度選擇器
- Matplotlib - 文字框
- Matplotlib 繪圖
- Matplotlib - 條形圖
- Matplotlib - 直方圖
- Matplotlib - 餅圖
- Matplotlib - 散點圖
- Matplotlib - 箱線圖
- Matplotlib - 小提琴圖
- Matplotlib - 等高線圖
- Matplotlib - 3D 繪圖
- Matplotlib - 3D 等高線
- Matplotlib - 3D 線框圖
- Matplotlib - 3D 表面圖
- Matplotlib - 矢羽圖
- Matplotlib 有用資源
- Matplotlib - 快速指南
- Matplotlib - 有用資源
- Matplotlib - 討論
Matplotlib - 多邊形編輯器
多邊形編輯器 (Poly Editor) 是多邊形編輯器 (Polygon Editor) 的簡稱,它是一個允許使用者在圖形環境中互動式編輯和操作多邊形頂點的應用程式。
在 Matplotlib 的上下文中,多邊形編輯器通常指的是一個跨GUI應用程式,它允許使用者互動式修改畫布上顯示的多邊形。此應用程式提供了諸如新增、刪除和移動多邊形頂點,以及使用滑鼠點選和鍵繫結調整其形狀和位置等功能。
本教程將演示如何使用 Matplotlib 的事件處理功能建立多邊形編輯器。
建立多邊形互動類
要建立多邊形編輯器,請定義一個名為 PolygonInteractor 的 Python 類,該類處理與多邊形頂點的互動。此類實現事件處理方法以響應使用者互動:
on_draw - 處理多邊形及其頂點的繪製。
on_button_press - 響應滑鼠按鈕按下以選擇頂點。
on_button_release - 處理滑鼠按鈕釋放。
on_key_press - 處理按鍵以切換頂點標記(使用“t”鍵)、刪除頂點(使用“d”鍵)或插入新頂點(使用“i”鍵)。
on_mouse_move - 處理滑鼠移動以拖動頂點並更新多邊形。
以下是 PolygonInteractor 類的實現:
class PolygonInteractor:

   showverts = True
   epsilon = 3

   def __init__(self, ax, poly):
      if poly.figure is None:
         raise RuntimeError('You must first add the polygon to a figure '
            'or canvas before defining the interactor')
      self.ax = ax
      canvas = poly.figure.canvas
      self.poly = poly

      x, y = zip(*self.poly.xy)
      self.line = Line2D(x, y,
         marker='o', markerfacecolor='r',
         animated=True)
      self.ax.add_line(self.line)

      self.cid = self.poly.add_callback(self.poly_changed)
      self._ind = None  # the active vert

      canvas.mpl_connect('draw_event', self.on_draw)
      canvas.mpl_connect('button_press_event', self.on_button_press)
      canvas.mpl_connect('key_press_event', self.on_key_press)
      canvas.mpl_connect('button_release_event', self.on_button_release)
      canvas.mpl_connect('motion_notify_event', self.on_mouse_move)
      self.canvas = canvas

   def on_draw(self, event):
      self.background = self.canvas.copy_from_bbox(self.ax.bbox)
      self.ax.draw_artist(self.poly)
      self.ax.draw_artist(self.line)


   def poly_changed(self, poly):
      vis = self.line.get_visible()
      Artist.update_from(self.line, poly)
      self.line.set_visible(vis)  # don't use the poly visibility state

   def get_ind_under_point(self, event):
      xy = np.asarray(self.poly.xy)
      xyt = self.poly.get_transform().transform(xy)
      xt, yt = xyt[:, 0], xyt[:, 1]
      d = np.hypot(xt - event.x, yt - event.y)
      indseq, = np.nonzero(d == d.min())
      ind = indseq[0]

      if d[ind] >= self.epsilon:
         ind = None

         return ind

   def on_button_press(self, event):

      if not self.showverts:
         return
      if event.inaxes is None:
         return
      if event.button != 1:
         return
      self._ind = self.get_ind_under_point(event)

   def on_button_release(self, event):

      if not self.showverts:
         return
      if event.button != 1:
         return
      self._ind = None

   def on_key_press(self, event):

      if not event.inaxes:
         return
      if event.key == 't':
            self.showverts = not self.showverts
            self.line.set_visible(self.showverts)
            if not self.showverts:
               self._ind = None
      elif event.key == 'd':
         ind = self.get_ind_under_point(event)
         if ind is not None:
            self.poly.xy = np.delete(self.poly.xy,
               ind, axis=0)
            self.line.set_data(zip(*self.poly.xy))
      elif event.key == 'i':
         xys = self.poly.get_transform().transform(self.poly.xy)
         p = event.x, event.y  # display coords
         for i in range(len(xys) - 1):
            s0 = xys[i]
            s1 = xys[i + 1]
            d = dist_point_to_segment(p, s0, s1)
            if d <= self.epsilon:
               self.poly.xy = np.insert(
                  self.poly.xy, i+1,
                  [event.xdata, event.ydata],
                  axis=0)
               self.line.set_data(zip(*self.poly.xy))
               break
      if self.line.stale:
         self.canvas.draw_idle()

   def on_mouse_move(self, event):
      if not self.showverts:
         return
      if self._ind is None:
         return
      if event.inaxes is None:
         return
      if event.button != 1:
         return
      x, y = event.xdata, event.ydata

      self.poly.xy[self._ind] = x, y
      if self._ind == 0:
         self.poly.xy[-1] = x, y
      elif self._ind == len(self.poly.xy) - 1:
         self.poly.xy[0] = x, y
      self.line.set_data(zip(*self.poly.xy))

      self.canvas.restore_region(self.background)
      self.ax.draw_artist(self.poly)
      self.ax.draw_artist(self.line)
      self.canvas.blit(self.ax.bbox)
定義實用程式函式
定義一個實用程式函式 dist_point_to_segment 來計算點和線段之間的距離。此函式用於確定在互動過程中哪個頂點最接近滑鼠游標。
def dist_point_to_segment(p, s0, s1):
   s01 = s1 - s0
   s0p = p - s0
   if (s01 == 0).all():
      return np.hypot(*s0p)

   p1 = s0 + np.clip((s0p @ s01) / (s01 @ s01), 0, 1) * s01
   return np.hypot(*(p - p1))
初始化多邊形編輯器
要初始化多邊形編輯器,我們需要建立一個 PolygonInteractor 類的例項,並將軸物件和多邊形物件傳遞給它。
if __name__ == '__main__':
import matplotlib.pyplot as plt
from matplotlib.patches import Polygon
theta = np.arange(0, 2*np.pi, 0.2)
r = 1.5
xs = r * np.cos(theta)
ys = r * np.sin(theta)
poly = Polygon(np.column_stack([xs, ys]), animated=True)
fig, ax = plt.subplots()
ax.add_patch(poly)
p = PolygonInteractor(ax, poly)
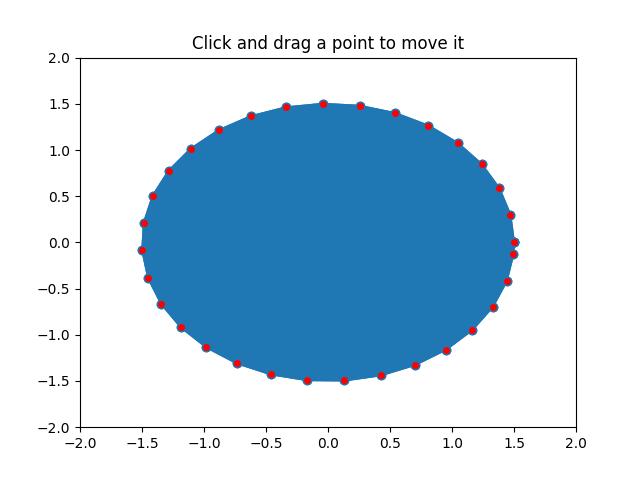
ax.set_title('Click and drag a point to move it')
ax.set_xlim((-2, 2))
ax.set_ylim((-2, 2))
plt.show()
執行多邊形編輯器
透過執行下面提供的完整程式碼,我們將得到一個 Matplotlib 視窗,其中顯示帶有多邊形的繪圖。我們可以透過單擊和拖動其頂點與多邊形進行互動,透過按“t”鍵切換頂點標記,按“d”鍵刪除頂點,按“i”鍵插入新頂點。
示例
import matplotlib.pyplot as plt
import numpy as np

from matplotlib.backend_bases import MouseButton
from matplotlib.patches import PathPatch
from matplotlib.path import Path

class PathInteractor:

    showverts = True
    # max pixel distance to count as a vertex hit
    epsilon = 5

    def __init__(self, pathpatch):
        # Initialization and event connections
        self.ax = pathpatch.axes
        canvas = self.ax.figure.canvas
        self.pathpatch = pathpatch
        self.pathpatch.set_animated(True)

        x, y = zip(*self.pathpatch.get_path().vertices)

        self.line, = ax.plot(
            x, y, marker='o', markerfacecolor='r', animated=True)

        self._ind = None  # the active vertex

        canvas.mpl_connect('draw_event', self.on_draw)
        canvas.mpl_connect('button_press_event', self.on_button_press)
        canvas.mpl_connect('key_press_event', self.on_key_press)
        canvas.mpl_connect('button_release_event', self.on_button_release)
        canvas.mpl_connect('motion_notify_event', self.on_mouse_move)
        self.canvas = canvas

    def get_ind_under_point(self, event):
        # Return the index of the point closest to the event position or None
        xy = self.pathpatch.get_path().vertices
        xyt = self.pathpatch.get_transform().transform(xy)  # to display coords
        xt, yt = xyt[:, 0], xyt[:, 1]
        d = np.sqrt((xt - event.x)**2 + (yt - event.y)**2)
        ind = d.argmin()
        return ind if d[ind] < self.epsilon else None

    def on_draw(self, event):
        # Callback for draws.
        self.background = self.canvas.copy_from_bbox(self.ax.bbox)
        self.ax.draw_artist(self.pathpatch)
        self.ax.draw_artist(self.line)
        self.canvas.blit(self.ax.bbox)

    def on_button_press(self, event):
        # Callback for mouse button presses
        if (event.inaxes is None
                or event.button != MouseButton.LEFT
                or not self.showverts):
            return
        self._ind = self.get_ind_under_point(event)

    def on_button_release(self, event):
        # Callback for mouse button releases
        if (event.button != MouseButton.LEFT
                or not self.showverts):
            return
        self._ind = None

    def on_key_press(self, event):
        # Callback for key presses
        if not event.inaxes:
            return
        if event.key == 't':
            self.showverts = not self.showverts
            self.line.set_visible(self.showverts)
            if not self.showverts:
                self._ind = None
        self.canvas.draw()

    def on_mouse_move(self, event):
        # Callback for mouse movements
        if (self._ind is None
                or event.inaxes is None
                or event.button != MouseButton.LEFT
                or not self.showverts):
            return

        vertices = self.pathpatch.get_path().vertices

        vertices[self._ind] = event.xdata, event.ydata
        self.line.set_data(zip(*vertices))

        self.canvas.restore_region(self.background)
        self.ax.draw_artist(self.pathpatch)
        self.ax.draw_artist(self.line)
        self.canvas.blit(self.ax.bbox)

fig, ax = plt.subplots()

pathdata = [
   (Path.MOVETO, (1.58, -2.57)),
   (Path.CURVE4, (0.35, -1.1)),
   (Path.CURVE4, (-1.75, 2.0)),
   (Path.CURVE4, (0.375, 2.0)),
   (Path.LINETO, (0.85, 1.15)),
   (Path.CURVE4, (2.2, 3.2)),
   (Path.CURVE4, (3, 0.05)),
   (Path.CURVE4, (2.0, -0.5)),
   (Path.CLOSEPOLY, (1.58, -2.57)),
]

codes, verts = zip(*pathdata)
path = Path(verts, codes)
patch = PathPatch(
   path, facecolor='green', edgecolor='yellow', alpha=0.5)
ax.add_patch(patch)

interactor = PathInteractor(patch)
ax.set_title('drag vertices to update path')
ax.set_xlim(-3, 4)
ax.set_ylim(-3, 4)

plt.show()
輸出
執行上述程式碼後,我們將獲得以下輸出:
觀看下面的影片以觀察此應用程式的工作方式:
