- Matplotlib 基礎
- Matplotlib - 首頁
- Matplotlib - 簡介
- Matplotlib - 與 Seaborn 的比較
- Matplotlib - 環境設定
- Matplotlib - Anaconda 發行版
- Matplotlib - Jupyter Notebook
- Matplotlib - Pyplot API
- Matplotlib - 簡單繪圖
- Matplotlib - 儲存圖表
- Matplotlib - 標記
- Matplotlib - 圖表
- Matplotlib - 樣式
- Matplotlib - 圖例
- Matplotlib - 顏色
- Matplotlib - 顏色對映
- Matplotlib - 顏色對映規範化
- Matplotlib - 選擇顏色對映
- Matplotlib - 顏色條
- Matplotlib - 文字
- Matplotlib - 文字屬性
- Matplotlib - 子圖示題
- Matplotlib - 圖片
- Matplotlib - 圖片蒙版
- Matplotlib - 註釋
- Matplotlib - 箭頭
- Matplotlib - 字型
- Matplotlib - 什麼是字型?
- 全域性設定字型屬性
- Matplotlib - 字型索引
- Matplotlib - 字型屬性
- Matplotlib - 刻度
- Matplotlib - 線性和對數刻度
- Matplotlib - 對稱對數和 Logit 刻度
- Matplotlib - LaTeX
- Matplotlib - 什麼是 LaTeX?
- Matplotlib - 用於數學表示式的 LaTeX
- Matplotlib - 註釋中的 LaTeX 文字格式
- Matplotlib - PostScript
- 啟用註釋中的 LaTeX 渲染
- Matplotlib - 數學表示式
- Matplotlib - 動畫
- Matplotlib - 繪圖元素
- Matplotlib - 使用 Cycler 進行樣式設定
- Matplotlib - 路徑
- Matplotlib - 路徑效果
- Matplotlib - 變換
- Matplotlib - 刻度和刻度標籤
- Matplotlib - 弧度刻度
- Matplotlib - 日期刻度
- Matplotlib - 刻度格式化器
- Matplotlib - 刻度定位器
- Matplotlib - 基本單位
- Matplotlib - 自動縮放
- Matplotlib - 反轉座標軸
- Matplotlib - 對數座標軸
- Matplotlib - Symlog
- Matplotlib - 單位處理
- Matplotlib - 帶單位的橢圓
- Matplotlib - 脊柱
- Matplotlib - 座標軸範圍
- Matplotlib - 座標軸刻度
- Matplotlib - 座標軸刻度
- Matplotlib - 格式化座標軸
- Matplotlib - Axes 類
- Matplotlib - 雙座標軸
- Matplotlib - Figure 類
- Matplotlib - 多圖
- Matplotlib - 網格
- Matplotlib - 面向物件介面
- Matplotlib - PyLab 模組
- Matplotlib - Subplots() 函式
- Matplotlib - Subplot2grid() 函式
- Matplotlib - 錨定繪圖元素
- Matplotlib - 手動等高線
- Matplotlib - 座標報告
- Matplotlib - AGG 濾鏡
- Matplotlib - 功能區
- Matplotlib - 填充螺旋線
- Matplotlib - Findobj 演示
- Matplotlib - 超連結
- Matplotlib - 圖片縮圖
- Matplotlib - 使用關鍵字繪圖
- Matplotlib - 建立 Logo
- Matplotlib - 多頁 PDF
- Matplotlib - 多程序
- Matplotlib - 列印標準輸出
- Matplotlib - 複合路徑
- Matplotlib - Sankey 類
- Matplotlib - MRI 與 EEG
- Matplotlib - 樣式表
- Matplotlib - 背景顏色
- Matplotlib - Basemap
- Matplotlib 事件處理
- Matplotlib - 事件處理
- Matplotlib - 關閉事件
- Matplotlib - 滑鼠移動
- Matplotlib - 點選事件
- Matplotlib - 滾動事件
- Matplotlib - 按鍵事件
- Matplotlib - 選擇事件
- Matplotlib - 透鏡
- Matplotlib - 路徑編輯器
- Matplotlib - 多邊形編輯器
- Matplotlib - 定時器
- Matplotlib - Viewlims
- Matplotlib - 縮放視窗
- Matplotlib 部件
- Matplotlib - 遊標部件
- Matplotlib - 帶註釋的遊標
- Matplotlib - 按鈕部件
- Matplotlib - 複選框
- Matplotlib - 套索選擇器
- Matplotlib - 選單部件
- Matplotlib - 滑鼠遊標
- Matplotlib - 多遊標
- Matplotlib - 多邊形選擇器
- Matplotlib - 單選按鈕
- Matplotlib - 範圍滑塊
- Matplotlib - 矩形選擇器
- Matplotlib - 橢圓選擇器
- Matplotlib - 滑塊部件
- Matplotlib - 跨度選擇器
- Matplotlib - 文字框
- Matplotlib 繪圖
- Matplotlib - 條形圖
- Matplotlib - 直方圖
- Matplotlib - 餅圖
- Matplotlib - 散點圖
- Matplotlib - 箱線圖
- Matplotlib - 小提琴圖
- Matplotlib - 等高線圖
- Matplotlib - 3D 繪圖
- Matplotlib - 3D 等高線
- Matplotlib - 3D 線框圖
- Matplotlib - 3D 表面圖
- Matplotlib - 矢羽圖
- Matplotlib 有用資源
- Matplotlib - 快速指南
- Matplotlib - 有用資源
- Matplotlib - 討論
Matplotlib - 遊標部件
什麼是遊標部件?
Matplotlib 遊標部件具體是指 Matplotlib 的 widgets 模組中的 Cursor 類。它提供了一種互動式顯示繪圖座標和資料值的方法,當遊標在繪圖上移動時,它會即時顯示相應位置的座標和資料。此功能對於互動式探索資料點或從繪圖中獲取特定資訊特別有用。
遊標部件的關鍵特性
以下是 matplotlb 庫遊標部件的關鍵特性。
互動式遊標 − Cursor 類建立一個互動式遊標,跟蹤滑鼠指標在 Matplotlib 繪圖上移動時的位置。
座標顯示 − 當遊標懸停在繪圖上時,部件會顯示資料座標中的 x 和 y 座標,這些座標對應於遊標的位置。
資料值顯示 − 我們可以選擇配置遊標以顯示遊標位置處的資料值或其他相關資訊,這對於視覺化特定資料點很有用。
使用遊標部件的基本工作流程
以下是遊標部件使用情況的基本流程圖。
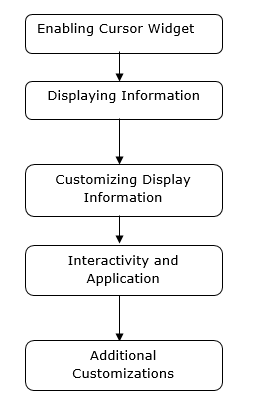
啟用遊標部件
在 Matplotlib 中啟用遊標部件涉及使用 `plt.connect()` 將一個函式連線到 `'motion_notify_event'` 事件,以處理繪圖上的遊標移動。
此設定允許我們互動式地在控制檯中檢視遊標的座標,當我們將它移動到繪圖上時。我們可以修改函式 `on_move()` 以執行其他操作或以不同的方式顯示資訊,這取決於我們的特定需求。
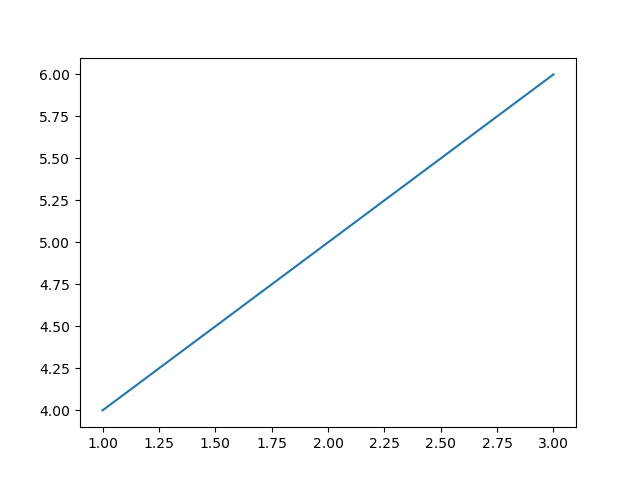
示例
在這個例子中,`on_move()` 是一個處理遊標移動事件的函式。它檢查遊標是否在繪圖區域內 (`event.inaxes`) 並檢索遊標的 x 和 y 座標 (`event.xdata` 和 `event.ydata`)。`plt.connect('motion_notify_event', on_move)` 將 `'motion_notify_event'` 連線到 `on_move()` 函式,這啟用了遊標部件。當遊標在繪圖上移動時,`on_move()` 函式將被觸發。
import matplotlib.pyplot as plt
# Function to handle cursor movement
def on_move(event):
   if event.inaxes:  # Check if the cursor is within the plot area
      x, y = event.xdata, event.ydata  # Get cursor position
      print(f'Cursor at x={x:.2f}, y={y:.2f}')  # Display coordinates
# Creating a plot
fig, ax = plt.subplots()
ax.plot([1, 2, 3], [4, 5, 6])
# Connecting the 'motion_notify_event' to the function 'on_move'
plt.connect('motion_notify_event', on_move)
plt.show()
輸出
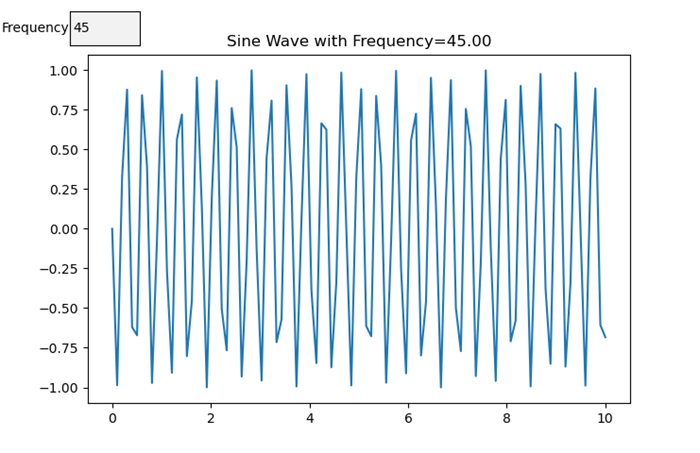
顯示資訊
在 Matplotlib 中的自定義部件中顯示資訊允許我們建立具有自定義元素的互動式繪圖,以展示特定資訊或增強使用者互動。讓我們建立一個簡單的示例。在這裡,我們將頻率設定為 45。
示例
import matplotlib.pyplot as plt
from matplotlib.widgets import TextBox, Button
import numpy as np
# Generate sample data
x = np.linspace(0, 10, 100)
y = np.sin(x)
# Create a plot
fig, ax = plt.subplots()
line, = ax.plot(x, y)
# Function to update the plot based on input
def update(text):
   frequency = float(text)  # Get the frequency value from the input
   new_y = np.sin(frequency * x)  # Generate new y values based on frequency
   line.set_ydata(new_y)  # Update the plot
   ax.set_title(f'Sine Wave with Frequency={frequency:.2f}')  # Update plot title
   fig.canvas.draw_idle()  # Redraw the plot
# Create a textbox widget for input
text_box = TextBox(plt.axes([0.1, 0.9, 0.1, 0.075]), 'Frequency')
text_box.on_submit(update)  # Connect the textbox to the update function
# Display the plot
plt.show()
輸出
自定義顯示資訊
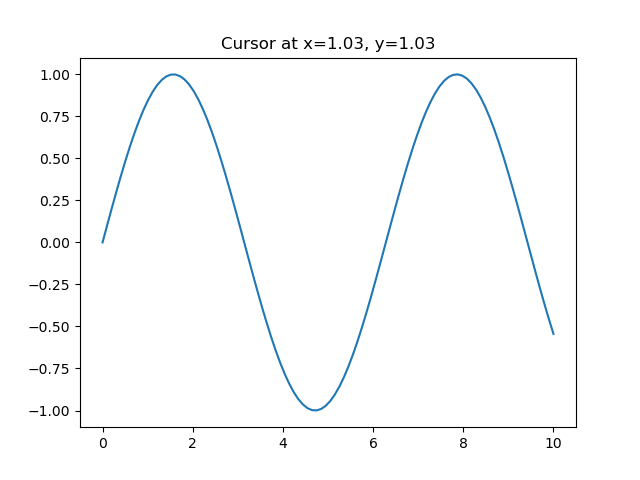
在 Matplotlib 中使用遊標部件時,我們可以根據遊標在繪圖上的位置自定義顯示的資訊。這是一個如何實現它的示例。
示例
import matplotlib.pyplot as plt
import numpy as np
# Generating sample data
x = np.linspace(0, 10, 100)
y = np.sin(x)
# Creating a plot
fig, ax = plt.subplots()
line, = ax.plot(x, y)
# Function to update displayed information based on cursor position
def update_cursor_info(event):
   if event.inaxes:
      x_cursor, y_cursor = event.xdata, event.ydata
      ax.set_title(f'Cursor at x={x_cursor:.2f}, y={y_cursor:.2f}')
      fig.canvas.draw_idle()
# Connecting the 'motion_notify_event' to update_cursor_info function
plt.connect('motion_notify_event', update_cursor_info)
plt.show()
輸出
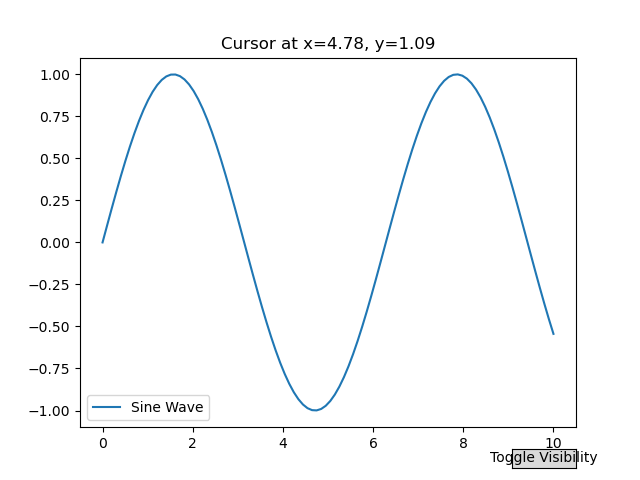
互動性和應用
遊標部件中的互動性提供了一種強大的方法來增強使用者與繪圖的互動。透過使用遊標部件,使用者可以互動式地探索資料點並獲得見解。讓我們增強之前的示例以演示互動性和潛在的應用。
示例
import matplotlib.pyplot as plt
import numpy as np
# Generating sample data
x = np.linspace(0, 10, 100)
y = np.sin(x)
# Creating a plot
fig, ax = plt.subplots()
line, = ax.plot(x, y, label='Sine Wave')
# Function to update displayed information based on cursor position
def update_cursor_info(event):
   if event.inaxes:
      x_cursor, y_cursor = event.xdata, event.ydata
      ax.set_title(f'Cursor at x={x_cursor:.2f}, y={y_cursor:.2f}')
      fig.canvas.draw_idle()
# Connecting the 'motion_notify_event' to update_cursor_info function
plt.connect('motion_notify_event', update_cursor_info)
# Adding a legend
ax.legend()
# Adding interactivity with a button to toggle visibility of the sine wave
def toggle_visibility(event):
   current_visibility = line.get_visible()
   line.set_visible(not current_visibility)
   ax.legend().set_visible(not current_visibility)
   fig.canvas.draw_idle()
# Creating a button widget
button_ax = plt.axes([0.8, 0.025, 0.1, 0.04])
toggle_button = plt.Button(button_ax, 'Toggle Visibility')
toggle_button.on_clicked(toggle_visibility)
plt.show()
輸出
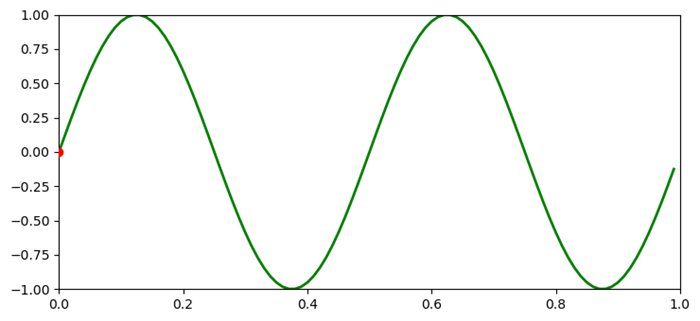
向曲線新增遊標
在這個例子中,我們在 Matplotlib 中向曲線添加了一個遊標。
示例
import matplotlib.pyplot as plt
import numpy as np

plt.rcParams["figure.figsize"] = [7.50, 3.50]
plt.rcParams["figure.autolayout"] = True

class CursorClass(object):
   def __init__(self, ax, x, y):
      self.ax = ax
      self.ly = ax.axvline(color='yellow', alpha=0.5)
      self.marker, = ax.plot([0], [0], marker="o", color="red", zorder=3)
      self.x = x
      self.y = y
      self.txt = ax.text(0.7, 0.9, '')

   def mouse_event(self, event):
      if event.inaxes:
         x, y = event.xdata, event.ydata
         indx = np.searchsorted(self.x, [x])[0]
         x = self.x[indx]
         y = self.y[indx]
         self.ly.set_xdata(x)
         self.marker.set_data([x], [y])
         self.txt.set_text('x=%1.2f, y=%1.2f' % (x, y))
         self.txt.set_position((x, y))
         self.ax.figure.canvas.draw_idle()
      else:
         return

t = np.arange(0.0, 1.0, 0.01)
s = np.sin(2 * 2 * np.pi * t)

fig, ax = plt.subplots()

cursor = CursorClass(ax, t, s)
cid = plt.connect('motion_notify_event', cursor.mouse_event)

ax.plot(t, s, lw=2, color='green')
plt.axis([0, 1, -1, 1])

plt.show()
輸出