- Matplotlib 基礎
- Matplotlib - 首頁
- Matplotlib - 簡介
- Matplotlib - 與 Seaborn 的對比
- Matplotlib - 環境設定
- Matplotlib - Anaconda 發行版
- Matplotlib - Jupyter Notebook
- Matplotlib - Pyplot API
- Matplotlib - 簡單繪圖
- Matplotlib - 儲存圖形
- Matplotlib - 標記
- Matplotlib - 圖形
- Matplotlib - 樣式
- Matplotlib - 圖例
- Matplotlib - 顏色
- Matplotlib - 色圖
- Matplotlib - 色圖歸一化
- Matplotlib - 選擇色圖
- Matplotlib - 色條
- Matplotlib - 文字
- Matplotlib - 文字屬性
- Matplotlib - 子圖示題
- Matplotlib - 影像
- Matplotlib - 影像蒙版
- Matplotlib - 標註
- Matplotlib - 箭頭
- Matplotlib - 字型
- Matplotlib - 什麼是字型?
- 全域性設定字型屬性
- Matplotlib - 字型索引
- Matplotlib - 字型屬性
- Matplotlib - 刻度
- Matplotlib - 線性和對數刻度
- Matplotlib - 對稱對數和 Logit 刻度
- Matplotlib - LaTeX
- Matplotlib - 什麼是 LaTeX?
- Matplotlib - LaTeX 用於數學表示式
- Matplotlib - LaTeX 在標註中的文字格式
- Matplotlib - PostScript
- 在標註中啟用 LaTeX 渲染
- Matplotlib - 數學表示式
- Matplotlib - 動畫
- Matplotlib - 藝術家
- Matplotlib - 使用 Cycler 進行樣式設定
- Matplotlib - 路徑
- Matplotlib - 路徑效果
- Matplotlib - 變換
- Matplotlib - 刻度和刻度標籤
- Matplotlib - 弧度刻度
- Matplotlib - 日期刻度
- Matplotlib - 刻度格式化程式
- Matplotlib - 刻度定位器
- Matplotlib - 基本單位
- Matplotlib - 自動縮放
- Matplotlib - 反轉軸
- Matplotlib - 對數軸
- Matplotlib - Symlog
- Matplotlib - 單位處理
- Matplotlib - 帶單位的橢圓
- Matplotlib - 脊柱
- Matplotlib - 軸範圍
- Matplotlib - 軸刻度
- Matplotlib - 軸刻度
- Matplotlib - 格式化軸
- Matplotlib - Axes 類
- Matplotlib - 雙軸
- Matplotlib - Figure 類
- Matplotlib - 多圖
- Matplotlib - 網格
- Matplotlib - 面向物件介面
- Matplotlib - PyLab 模組
- Matplotlib - Subplots() 函式
- Matplotlib - Subplot2grid() 函式
- Matplotlib - 固定藝術家
- Matplotlib - 手動等值線
- Matplotlib - 座標報告
- Matplotlib - AGG 過濾器
- Matplotlib - 帶狀框
- Matplotlib - 填充螺旋
- Matplotlib - Findobj 演示
- Matplotlib - 超連結
- Matplotlib - 影像縮圖
- Matplotlib - 使用關鍵字繪圖
- Matplotlib - 建立徽標
- Matplotlib - 多頁 PDF
- Matplotlib - 多程序
- Matplotlib - 列印標準輸出
- Matplotlib - 複合路徑
- Matplotlib - Sankey 類
- Matplotlib - 帶 EEG 的 MRI
- Matplotlib - 樣式表
- Matplotlib - 背景顏色
- Matplotlib - Basemap
- Matplotlib 事件處理
- Matplotlib - 事件處理
- Matplotlib - 關閉事件
- Matplotlib - 滑鼠移動
- Matplotlib - 點選事件
- Matplotlib - 滾動事件
- Matplotlib - 按鍵事件
- Matplotlib - 選擇事件
- Matplotlib - 觀察鏡
- Matplotlib - 路徑編輯器
- Matplotlib - 多邊形編輯器
- Matplotlib - 計時器
- Matplotlib - Viewlims
- Matplotlib - 縮放視窗
- Matplotlib 小部件
- Matplotlib - 游標小部件
- Matplotlib - 帶註釋的游標
- Matplotlib - 按鈕小部件
- Matplotlib - 複選框
- Matplotlib - 套索選擇器
- Matplotlib - 選單小部件
- Matplotlib - 滑鼠游標
- Matplotlib - 多游標
- Matplotlib - 多邊形選擇器
- Matplotlib - 單選按鈕
- Matplotlib - RangeSlider
- Matplotlib - 矩形選擇器
- Matplotlib - 橢圓選擇器
- Matplotlib - 滑塊小部件
- Matplotlib - 跨度選擇器
- Matplotlib - 文字框
- Matplotlib 繪圖
- Matplotlib - 條形圖
- Matplotlib - 直方圖
- Matplotlib - 餅圖
- Matplotlib - 散點圖
- Matplotlib - 箱線圖
- Matplotlib - 小提琴圖
- Matplotlib - 等值線圖
- Matplotlib - 3D 繪圖
- Matplotlib - 3D 等值線
- Matplotlib - 3D 線框圖
- Matplotlib - 3D 表面圖
- Matplotlib - Quiver 圖
- Matplotlib 有用資源
- Matplotlib - 快速指南
- Matplotlib - 有用資源
- Matplotlib - 討論
Matplotlib - 複合路徑
在圖形和設計中,“路徑”是指由線或曲線連線的一系列點。它就像從一個點到另一個點畫一條線。“複合”表示由多個部分或元素組成。
想象一下,您有幾個基本形狀,例如圓形、矩形和線條。單獨來看,這些形狀很簡單,並且在它們可以表示的內容方面受到限制。但是,透過將它們以不同的排列和方向組合在一起,您可以建立更復雜和有趣的形狀。這個將簡單形狀組合以建立更復雜形狀的過程就是所謂的使用複合路徑。
Matplotlib 中的複合路徑
Matplotlib 中的複合路徑是指多個簡單路徑或形狀的組合,這些路徑或形狀組合在一起形成更復雜的形狀。這些簡單路徑可以是線、曲線、多邊形或其他基本形狀。
在 Matplotlib 中,您可以使用“Path”類建立複合路徑,該類允許您透過指定描述路徑段的頂點和程式碼來定義自定義路徑。然後,您可以使用這些自定義路徑在繪圖上繪製複雜的形狀或圖案。
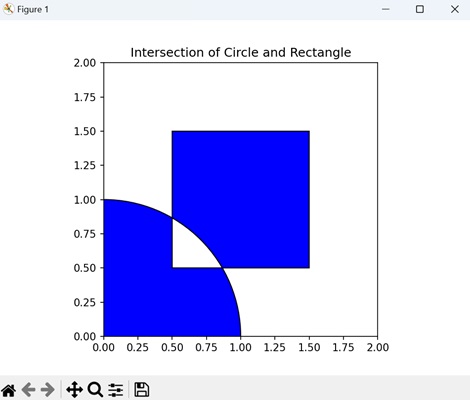
複合路徑:圓形和矩形的交集
Matplotlib 中圓形和矩形交集的複合路徑是指建立一個表示圓形和矩形重疊或相交區域的單個形狀。您不是將圓形和矩形視為單獨的實體,而是將它們組合在一起以形成一個新的、更復雜的形狀,該形狀捕獲它們相交的公共區域。
在 Matplotlib 中,您可以透過定義描述每個形狀的路徑段的頂點和程式碼來建立圓形和矩形交集的複合路徑。然後,您將這些路徑組合在一起以形成表示交集的複合路徑。建立後,您可以使用此複合路徑在繪圖上繪製相交區域。
示例
在以下示例中,我們透過將它們的頂點和程式碼組合到單個 Path 物件中來建立一個表示圓形和矩形交集的複合路徑 -
import matplotlib.pyplot as plt
from matplotlib.path import Path
from matplotlib.patches import PathPatch

# Defining the paths for the shapes
circle = Path.unit_circle()
rect = Path([(0.5, 0.5), (0.5, 1.5), (1.5, 1.5), (1.5, 0.5), (0.5, 0.5)], closed=True)

# Combining the paths into a compound path (Intersection)
compound_vertices = circle.vertices.tolist() + rect.vertices.tolist()
compound_codes = circle.codes.tolist() + rect.codes.tolist()
compound_path = Path(compound_vertices, compound_codes)

# Plotting the compound path
fig, ax = plt.subplots()
patch = PathPatch(compound_path, facecolor='blue', edgecolor='black')
ax.add_patch(patch)

# Setting plot limits and aspect ratio
ax.set_xlim(0, 2)
ax.set_ylim(0, 2)
ax.set_aspect('equal')

# Showing the plot
plt.title('Intersection of Circle and Rectangle')
plt.show()
輸出
以下是上述程式碼的輸出 -
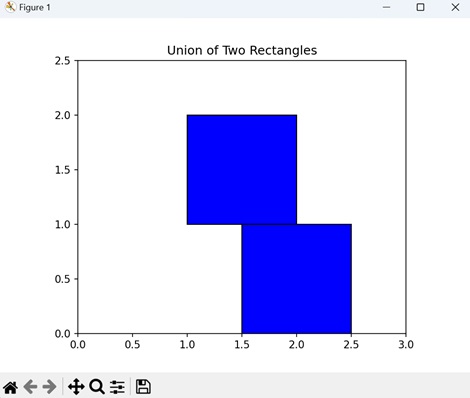
兩個矩形並集的複合路徑
Matplotlib 中兩個矩形並集的複合路徑是指透過組合兩個獨立矩形覆蓋的區域來建立一個單個形狀。您不是將矩形視為單個形狀,而是將它們合併在一起以形成一個新的、更復雜的形狀。
在 Matplotlib 中,您可以透過定義描述每個矩形的路徑段的頂點和程式碼來建立兩個矩形並集的複合路徑。然後,您將這些路徑組合在一起以形成表示矩形並集的複合路徑。建立後,您可以使用此複合路徑在繪圖上繪製組合形狀。
示例
在這裡,我們透過將它們的頂點和程式碼組合到單個 Path 物件中來建立一個表示兩個矩形並集的複合路徑 -
import matplotlib.pyplot as plt
from matplotlib.path import Path
from matplotlib.patches import PathPatch

# Defining the paths for the shapes
# Rectangle 1
path1 = Path([(1, 1), (1, 2), (2, 2), (2, 1), (1, 1)], closed=True)
# Rectangle 2
path2 = Path([(1.5, 0), (1.5, 1), (2.5, 1), (2.5, 0), (1.5, 0)], closed=True)

# Combining the paths into a compound path (Union)
compound_vertices = path1.vertices.tolist() + path2.vertices.tolist()
compound_codes = path1.codes.tolist() + path2.codes.tolist()
compound_path = Path(compound_vertices, compound_codes)

# Plotting the compound path
fig, ax = plt.subplots()
patch = PathPatch(compound_path, facecolor='blue', edgecolor='black')
ax.add_patch(patch)

# Setting plot limits and aspect ratio
ax.set_xlim(0, 3)
ax.set_ylim(0, 2.5)
ax.set_aspect('equal')

# Displaying the plot
plt.title('Union of Two Rectangles')
plt.show()
輸出
執行上述程式碼後,我們將獲得以下輸出 -
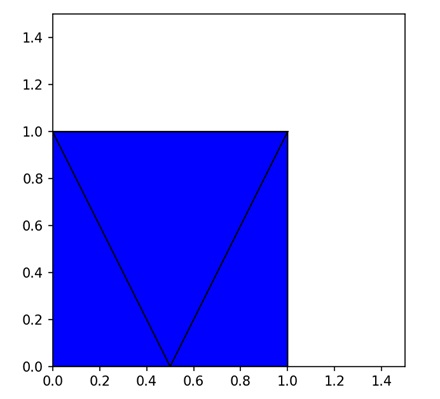
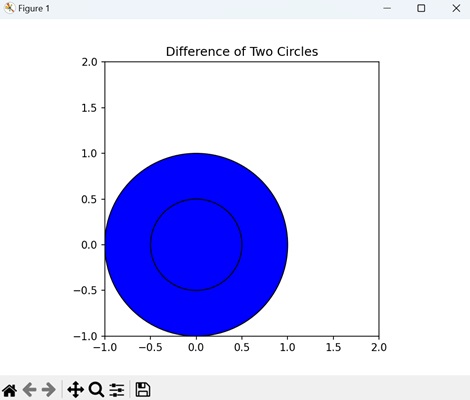
複合路徑:兩個圓形的差集
Matplotlib 中兩個圓形差集的複合路徑是指建立一個表示從另一個圓形中減去一個圓形後剩餘區域的單個形狀。
在 Matplotlib 中,您可以透過定義描述每個圓形的路徑段的頂點和程式碼來建立兩個圓形差集的複合路徑。然後,您將這些路徑組合在一起,並將較小圓形的路徑從較大圓形的路徑中減去,以形成表示差集的複合路徑。建立後,您可以使用此複合路徑在繪圖上繪製剩餘的環形區域。
示例
現在,我們透過將它們的頂點和程式碼組合到單個 Path 物件中來建立一個表示兩個圓形之間差異的複合路徑 -
import matplotlib.pyplot as plt
from matplotlib.path import Path
from matplotlib.patches import PathPatch
import numpy as np

# Defining the paths for the shapes
circle1 = Path.unit_circle()
circle2 = Path.unit_circle().transformed(plt.matplotlib.transforms.Affine2D().scale(0.5))

# Combining the paths into a compound path (Difference)
compound_vertices = np.concatenate([circle1.vertices, circle2.vertices])
compound_codes = np.concatenate([circle1.codes, circle2.codes])
compound_path = Path(compound_vertices, compound_codes)

# Plotting the compound path
fig, ax = plt.subplots()
patch = PathPatch(compound_path, facecolor='blue', edgecolor='black')
ax.add_patch(patch)

# Setting plot limits and aspect ratio
ax.set_xlim(-1, 2)
ax.set_ylim(-1, 2)
ax.set_aspect('equal')

# Displaying the plot
plt.title('Difference of Two Circles')
plt.show()
輸出
執行上述程式碼後,我們將獲得以下輸出 -
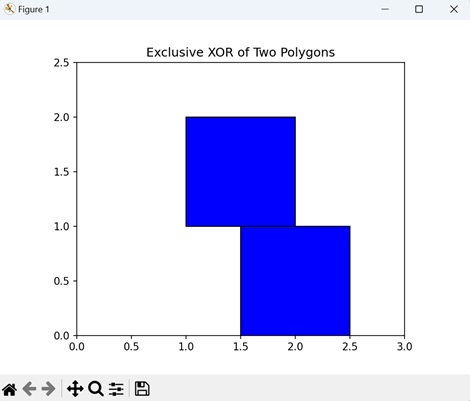
複合路徑:兩個多邊形的異或
Matplotlib 中兩個多邊形的異或(異或)的複合路徑表示兩個多邊形的組合,其中僅保留不重疊的區域。換句話說,它顯示了專屬於其中一個多邊形但不屬於兩個多邊形的區域。
在 Matplotlib 中,您可以透過定義描述每個多邊形的路徑段的頂點和程式碼來建立兩個多邊形異或的複合路徑。然後,您將這些路徑組合在一起並應用異或運算以確定專屬於一個多邊形或另一個多邊形的區域。生成的複合路徑表示這些不重疊的區域,您可以使用它們在繪圖上進行繪製。
示例
在此示例中,我們透過將它們的頂點和程式碼組合到單個 Path 物件中來建立一個表示對兩個多邊形執行異或運算的複合路徑 -
import matplotlib.pyplot as plt
from matplotlib.path import Path
from matplotlib.patches import PathPatch

# Defining the paths for the shapes
poly1 = Path([(1, 1), (1, 2), (2, 2), (2, 1), (1, 1)], closed=True)  # Rectangle
poly2 = Path([(1.5, 0), (1.5, 1), (2.5, 1), (2.5, 0), (1.5, 0)], closed=True)  # Triangle

# Combining the paths into a compound path (Exclusive XOR)
compound_vertices = poly1.vertices.tolist() + poly2.vertices.tolist()
compound_codes = poly1.codes.tolist() + poly2.codes.tolist()
compound_path = Path(compound_vertices, compound_codes)

# Plotting the compound path
fig, ax = plt.subplots()
patch = PathPatch(compound_path, facecolor='blue', edgecolor='black')
ax.add_patch(patch)

# Setting plot limits and aspect ratio
ax.set_xlim(0, 3)
ax.set_ylim(0, 2.5)
ax.set_aspect('equal')

# Displaying the plot
plt.title('Exclusive XOR of Two Polygons')
plt.show()
輸出
執行上述程式碼後,我們將獲得以下輸出 -