- Matplotlib 基礎
- Matplotlib - 首頁
- Matplotlib - 簡介
- Matplotlib - 與 Seaborn 的比較
- Matplotlib - 環境設定
- Matplotlib - Anaconda 發行版
- Matplotlib - Jupyter Notebook
- Matplotlib - Pyplot API
- Matplotlib - 簡單繪圖
- Matplotlib - 儲存圖形
- Matplotlib - 標記
- Matplotlib - 圖形
- Matplotlib - 風格
- Matplotlib - 圖例
- Matplotlib - 顏色
- Matplotlib - 顏色圖
- Matplotlib - 顏色圖歸一化
- Matplotlib - 選擇顏色圖
- Matplotlib - 顏色條
- Matplotlib - 文字
- Matplotlib - 文字屬性
- Matplotlib - 子圖示題
- Matplotlib - 圖片
- Matplotlib - 圖片蒙版
- Matplotlib - 註釋
- Matplotlib - 箭頭
- Matplotlib - 字型
- Matplotlib - 什麼是字型?
- 全域性設定字型屬性
- Matplotlib - 字型索引
- Matplotlib - 字型屬性
- Matplotlib - 刻度
- Matplotlib - 線性和對數刻度
- Matplotlib - 對稱對數和 Logit 刻度
- Matplotlib - LaTeX
- Matplotlib - 什麼是 LaTeX?
- Matplotlib - 用於數學表示式的 LaTeX
- Matplotlib - 註釋中的 LaTeX 文字格式
- Matplotlib - PostScript
- 啟用註釋中的 LaTeX 渲染
- Matplotlib - 數學表示式
- Matplotlib - 動畫
- Matplotlib - 繪圖元素
- Matplotlib - 使用 Cycler 進行樣式設定
- Matplotlib - 路徑
- Matplotlib - 路徑效果
- Matplotlib - 變換
- Matplotlib - 刻度和刻度標籤
- Matplotlib - 弧度刻度
- Matplotlib - 日期刻度
- Matplotlib - 刻度格式化器
- Matplotlib - 刻度定位器
- Matplotlib - 基本單位
- Matplotlib - 自動縮放
- Matplotlib - 反轉座標軸
- Matplotlib - 對數座標軸
- Matplotlib - Symlog
- Matplotlib - 單位處理
- Matplotlib - 帶有單位的橢圓
- Matplotlib - 脊柱
- Matplotlib - 座標軸範圍
- Matplotlib - 座標軸刻度
- Matplotlib - 座標軸刻度
- Matplotlib - 格式化座標軸
- Matplotlib - Axes 類
- Matplotlib - 雙座標軸
- Matplotlib - Figure 類
- Matplotlib - 多圖
- Matplotlib - 網格
- Matplotlib - 面向物件介面
- Matplotlib - PyLab 模組
- Matplotlib - Subplots() 函式
- Matplotlib - Subplot2grid() 函式
- Matplotlib - 固定位置繪圖元素
- Matplotlib - 手動等高線
- Matplotlib - 座標報告
- Matplotlib - AGG 過濾器
- Matplotlib - 帶狀框
- Matplotlib - 填充螺旋線
- Matplotlib - Findobj 演示
- Matplotlib - 超連結
- Matplotlib - 圖片縮圖
- Matplotlib - 使用關鍵字進行繪圖
- Matplotlib - 建立 Logo
- Matplotlib - 多頁 PDF
- Matplotlib - 多程序
- Matplotlib - 列印標準輸出
- Matplotlib - 複合路徑
- Matplotlib - Sankey 類
- Matplotlib - MRI 與 EEG
- Matplotlib - 風格表
- Matplotlib - 背景顏色
- Matplotlib - Basemap
- Matplotlib 事件處理
- Matplotlib - 事件處理
- Matplotlib - 關閉事件
- Matplotlib - 滑鼠移動
- Matplotlib - 點選事件
- Matplotlib - 滾動事件
- Matplotlib - 按鍵事件
- Matplotlib - 選擇事件
- Matplotlib - 透視鏡
- Matplotlib - 路徑編輯器
- Matplotlib - 多邊形編輯器
- Matplotlib - 定時器
- Matplotlib - Viewlims
- Matplotlib - 縮放視窗
- Matplotlib 控制元件
- Matplotlib - 游標控制元件
- Matplotlib - 帶註釋的游標
- Matplotlib - 按鈕控制元件
- Matplotlib - 複選框
- Matplotlib - 套索選擇器
- Matplotlib - 選單控制元件
- Matplotlib - 滑鼠游標
- Matplotlib - 多游標
- Matplotlib - 多邊形選擇器
- Matplotlib - 單選按鈕
- Matplotlib - 範圍滑塊
- Matplotlib - 矩形選擇器
- Matplotlib - 橢圓選擇器
- Matplotlib - 滑塊控制元件
- Matplotlib - 區間選擇器
- Matplotlib - 文字框
- Matplotlib 繪圖
- Matplotlib - 條形圖
- Matplotlib - 直方圖
- Matplotlib - 餅圖
- Matplotlib - 散點圖
- Matplotlib - 箱線圖
- Matplotlib - 小提琴圖
- Matplotlib - 等高線圖
- Matplotlib - 3D 繪圖
- Matplotlib - 3D 等高線
- Matplotlib - 3D 線框圖
- Matplotlib - 3D 表面圖
- Matplotlib - 矢羽圖
- Matplotlib 有用資源
- Matplotlib - 快速指南
- Matplotlib - 有用資源
- Matplotlib - 討論
Matplotlib - 風格表
什麼是樣式表?
在 Matplotlib 庫中,樣式表是預定義的一組美學配置,用於控制繪圖的整體外觀。它們提供了一種便捷的方式,只需最少的努力即可更改繪圖的外觀和感覺。
樣式表包含對繪圖各種元素的預定義設定,例如顏色、線型、字型、網格樣式等等。Matplotlib 提供了一組內建樣式表,使我們能夠快速將不同的視覺主題應用於我們的繪圖。
當沒有設定特定樣式時,將使用預設樣式,但 Matplotlib 包括其他幾種樣式,例如 **gplot、seaborn、bmh、dark_background** 等等。這些樣式表提供了不同的配色方案、線型、字型設定和整體美學。
Matplotlib 提供了各種內建樣式表。以下是關於如何使用它們概述:
檢視可用的樣式表
Matplotlib 提供不同的樣式表,這些樣式表會改變繪圖的整體外觀,並更改顏色、線型、字型大小等元素。樣式表提供了一種快速簡便的方法來更改視覺化的美學。
語法
我們可以使用以下語法檢查可用的樣式表。
plt.style.available
示例
在這個例子中,我們使用 **plt.style.available** 獲取 Matplotlib 庫中所有可用的樣式表。
import matplotlib.pyplot as plt
# List available stylesheets
print("Available stylesheets:", plt.style.available)
輸出
Available stylesheets: [
   'Solarize_Light2', '_classic_test_patch',
   '_mpl-gallery', '_mpl-gallery-nogrid', 'bmh', 'classic',
   'dark_background', 'fast', 'fivethirtyeight',
   'ggplot', 'grayscale', 'seaborn', 'seaborn-bright',
   'seaborn-colorblind', 'seaborn-dark',
   'seaborn-dark-palette', 'seaborn-darkgrid',
   'seaborn-deep', 'seaborn-muted', 'seaborn-notebook',
   'seaborn-paper', 'seaborn-pastel', 'seaborn-poster',
   'seaborn-talk', 'seaborn-ticks', 'seaborn-white',
   'seaborn-whitegrid', 'tableau-colorblind10']
使用樣式表
使用 Matplotlib 樣式表非常簡單。我們可以將特定樣式應用於我們的繪圖。以下是語法。
語法
plt.style.use('stylesheet_name')
其中:
**plt.style.use()** - 用於將定義的樣式表應用於整個繪圖。
**stylesheet_name** - 我們想要應用的樣式表的名稱。
示例
在這個例子中,我們透過在建立繪圖之前使用 **plt.style.use('ggplot')** 來使用 **'ggplot'** 樣式表。
import matplotlib.pyplot as plt
# Using a specific stylesheet
plt.style.use('ggplot')  # Example: Using the 'ggplot' style
x = [10,30,20,50]
y = [30,23,45,10]
plt.plot(x,y)
plt.title("Plot with ggplot style sheet")
plt.show()
輸出

臨時應用樣式表
如果我們想將樣式表臨時應用於特定程式碼塊而不影響其他繪圖,我們可以使用 **plt.style.context('stylesheet_name')**。
此臨時上下文僅在 `with` 語句下縮排的程式碼塊內應用指定的樣式。
示例
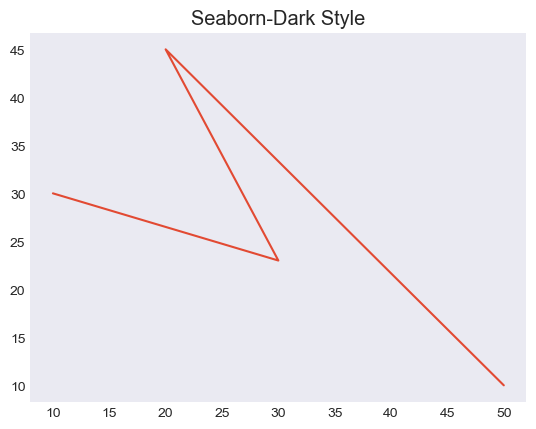
在這個例子中,我們使用 Matplotlib 庫中可用的 plt.style.context() 函式將樣式表設定為 **seaborn-dark**。
import matplotlib.pyplot as plt
x = [10,30,20,50]
y = [30,23,45,10]
with plt.style.context('seaborn-dark'):
   # Code for a plot with 'seaborn-dark' style
   plt.plot(x, y)
   plt.title('Seaborn-Dark Style')
   plt.show()  # The 'seaborn-dark' style will only affect this plot
輸出
建立自定義樣式表
我們還可以透過定義 **.mplstyle** 檔案或使用指定樣式引數的 Python 字典來建立自定義樣式表:
示例
在這個例子中,我們使用字典建立自定義樣式表。
import matplotlib.pyplot as plt
# Define a custom style using a dictionary
custom_style = {
   'lines.linewidth': 10,
   'lines.color': 'red',
   'axes.labelsize': 30,
   # Add more style configurations as needed
}
# Use the custom style
plt.style.use(custom_style)
x = [10,30,20,50]
y = [30,23,45,10]
plt.plot(x,y)
plt.title("Plot with custom style sheet")
plt.show()
輸出

樣式表提供了一種有效的方法來維護多個繪圖之間的一致性,或者輕鬆地試驗各種視覺樣式。我們可以選擇最符合我們的偏好或資料視覺化特定要求的樣式表。