- Matplotlib 基礎
- Matplotlib - 首頁
- Matplotlib - 簡介
- Matplotlib - 與 Seaborn 的比較
- Matplotlib - 環境設定
- Matplotlib - Anaconda 發行版
- Matplotlib - Jupyter Notebook
- Matplotlib - Pyplot API
- Matplotlib - 簡單繪圖
- Matplotlib - 儲存圖形
- Matplotlib - 標記
- Matplotlib - 圖形
- Matplotlib - 樣式
- Matplotlib - 圖例
- Matplotlib - 顏色
- Matplotlib - 顏色圖
- Matplotlib - 顏色圖歸一化
- Matplotlib - 選擇顏色圖
- Matplotlib - 顏色條
- Matplotlib - 文字
- Matplotlib - 文字屬性
- Matplotlib - 子圖示題
- Matplotlib - 影像
- Matplotlib - 影像蒙版
- Matplotlib - 註釋
- Matplotlib - 箭頭
- Matplotlib - 字型
- Matplotlib - 什麼是字型?
- 全域性設定字型屬性
- Matplotlib - 字型索引
- Matplotlib - 字型屬性
- Matplotlib - 刻度
- Matplotlib - 線性刻度和對數刻度
- Matplotlib - 對稱對數刻度和 Logit 刻度
- Matplotlib - LaTeX
- Matplotlib - 什麼是 LaTeX?
- Matplotlib - 用於數學表示式的 LaTeX
- Matplotlib - 註釋中的 LaTeX 文字格式
- Matplotlib - PostScript
- 啟用註釋中的 LaTeX 渲染
- Matplotlib - 數學表示式
- Matplotlib - 動畫
- Matplotlib - 藝術家
- Matplotlib - 使用 Cycler 進行樣式設定
- Matplotlib - 路徑
- Matplotlib - 路徑效果
- Matplotlib - 變換
- Matplotlib - 刻度和刻度標籤
- Matplotlib - 弧度刻度
- Matplotlib - 日期刻度
- Matplotlib - 刻度格式化程式
- Matplotlib - 刻度定位器
- Matplotlib - 基本單位
- Matplotlib - 自動縮放
- Matplotlib - 反轉軸
- Matplotlib - 對數軸
- Matplotlib - Symlog
- Matplotlib - 單位處理
- Matplotlib - 帶單位的橢圓
- Matplotlib - 脊柱
- Matplotlib - 軸範圍
- Matplotlib - 軸刻度
- Matplotlib - 軸刻度
- Matplotlib - 格式化軸
- Matplotlib - Axes 類
- Matplotlib - 雙軸
- Matplotlib - Figure 類
- Matplotlib - 多圖
- Matplotlib - 網格
- Matplotlib - 面向物件介面
- Matplotlib - PyLab 模組
- Matplotlib - Subplots() 函式
- Matplotlib - Subplot2grid() 函式
- Matplotlib - 錨定藝術家
- Matplotlib - 手動等高線
- Matplotlib - 座標報告
- Matplotlib - AGG 過濾器
- Matplotlib - 帶狀框
- Matplotlib - 填充螺旋線
- Matplotlib - Findobj 演示
- Matplotlib - 超連結
- Matplotlib - 影像縮圖
- Matplotlib - 使用關鍵字繪圖
- Matplotlib - 建立徽標
- Matplotlib - 多頁 PDF
- Matplotlib - 多程序
- Matplotlib - 列印標準輸出
- Matplotlib - 複合路徑
- Matplotlib - Sankey 類
- Matplotlib - 帶 EEG 的 MRI
- Matplotlib - 樣式表
- Matplotlib - 背景顏色
- Matplotlib - Basemap
- Matplotlib 事件處理
- Matplotlib - 事件處理
- Matplotlib - 關閉事件
- Matplotlib - 滑鼠移動
- Matplotlib - 點選事件
- Matplotlib - 滾動事件
- Matplotlib - 按鍵事件
- Matplotlib - 選擇事件
- Matplotlib - 透鏡
- Matplotlib - 路徑編輯器
- Matplotlib - 多邊形編輯器
- Matplotlib - 計時器
- Matplotlib - Viewlims
- Matplotlib - 縮放視窗
- Matplotlib 小部件
- Matplotlib - 游標小部件
- Matplotlib - 帶註釋的游標
- Matplotlib - 按鈕小部件
- Matplotlib - 複選框
- Matplotlib - 套索選擇器
- Matplotlib - 選單小部件
- Matplotlib - 滑鼠游標
- Matplotlib - 多游標
- Matplotlib - 多邊形選擇器
- Matplotlib - 單選按鈕
- Matplotlib - RangeSlider
- Matplotlib - 矩形選擇器
- Matplotlib - 橢圓選擇器
- Matplotlib - 滑塊小部件
- Matplotlib - 區間選擇器
- Matplotlib - 文字框
- Matplotlib 繪圖
- Matplotlib - 條形圖
- Matplotlib - 直方圖
- Matplotlib - 餅圖
- Matplotlib - 散點圖
- Matplotlib - 箱線圖
- Matplotlib - 小提琴圖
- Matplotlib - 等高線圖
- Matplotlib - 3D 繪圖
- Matplotlib - 3D 等高線
- Matplotlib - 3D 線框圖
- Matplotlib - 3D 表面圖
- Matplotlib - Quiver 圖
- Matplotlib 有用資源
- Matplotlib - 快速指南
- Matplotlib - 有用資源
- Matplotlib - 討論
Matplotlib - 藝術家
理解 Matplotlib 中的藝術家
在 Matplotlib 中,你幾乎在繪圖上看到的任何東西都是藝術家的一個例項,它們是表示繪圖各個元件的物件。無論是表示資料的線,文字標籤,甚至是軸上的刻度標記,Matplotlib 繪圖中的所有內容都是一個藝術家物件。
在探索藝術家層次結構之前,讓我們觀察下面的影像以瞭解 matplotlib 中圖形的基本元件:
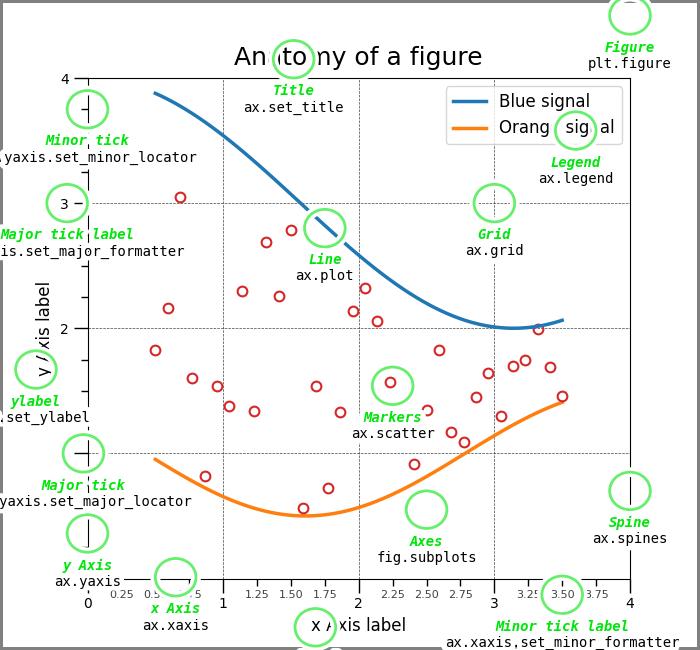
在圖中,每個元素,例如表示資料的線和點,以及與文字標籤相關的次要刻度和點,都可以識別為單獨的藝術家物件。
藝術家層次結構
在 matplotlib 的層次結構中,藝術家可以大致分為兩種型別:
- 基本藝術家 - 這些是繪圖的基本構建塊。示例包括Line2D、Rectangle、Text、AxesImage等等。這些是我們想要繪製到畫布上的標準圖形物件。
- 複合藝術家 - 這些是包含其他藝術家的更高級別結構。示例包括Figure、Axis和Axes。Figure 就像一個包含所有內容的畫布,而 Axes 表示圖形內的特定繪圖。
建立和訪問藝術家
藝術家通常是透過 Axes 物件上的繪圖方法建立的。這些方法不僅促進了可視元素的建立,還返回與已繪製元素對應的特定藝術家例項。
以下是一些常見的繪圖方法以及它們生成的相應藝術家:
- annotate - 為文字註釋生成Annotation藝術家。
- bar - 為條形圖建立Rectangle藝術家。
- errorbar - 為誤差條形圖生成Line2D和Rectangle藝術家。
- fill - 為共享區域生成Polygon藝術家。
- hist - 為直方圖建立Rectangle藝術家。
- imshow - 為影像資料生成AxesImage藝術家。
- legend - 為 Axes 圖例生成Legend藝術家。
- plot - 為 XY 圖建立Line2D藝術家。繪製多個數據集時返回列表。
- scatter - 為散點圖生成PolyCollection藝術家。
- text - 生成Text藝術家以在繪圖上顯示文字。
示例
讓我們來看一個使用plot()方法建立和訪問藝術家的示例。
import matplotlib.pyplot as plt
import matplotlib.artist as martist
import numpy as np

# Create a subplot
fig, ax = plt.subplots()

# Generate random data
x, y = np.random.rand(2, 100)

# Use the plot method to create a Line2D artist
lines = ax.plot(x, y, '-', label='example')

# Accessing the Line2D artists created by the plot method
print('Line2D artists created by the plot method:', lines)

# Retrieve all Line2D artists associated with the Axes
lines_on_axes = ax.get_lines()

# Display the retrieved Line2D artists
print('Line2D artists obtained using get_lines():', lines_on_axes)

# Accessing the first (and in this case, the only) Line2D artist
print('Accessing the first Line2D artist', ax.get_lines()[0])
輸出
執行上述程式碼後,我們將得到以下輸出:
Line2D artists created by the plot method: [<matplotlib.lines.Line2D object at 0x000001DB3666A620>]
Line2D artists obtained using get_lines():
Accessing the first Line2D artist Line2D(example)
修改藝術家屬性
藝術家具有各種定義其外觀和行為的屬性。這些屬性包括顏色、線型、線寬和標記。修改這些屬性使我們能夠控制繪圖的視覺方面。
示例
以下示例演示如何建立簡單的繪圖,然後修改關聯的 Line2D 藝術家的屬性。
import matplotlib.pyplot as plt
import numpy as np

# Creating a simple plot
fig, ax = plt.subplots(figsize=(7, 4))
x = np.linspace(0, 2 * np.pi, 100)
y = np.sin(x)

# Use the plot method to create a Line2D artist
lines = ax.plot(x, y)

# Displaying initial properties of the Line2D artist
print('Initial properties of the Line2D artist:')
print('Color:', ax.get_lines()[0].get_color())
print('Line Style:', ax.get_lines()[0].get_linestyle())
print('Marker Size:', ax.get_lines()[0].get_markersize())

# Modifying properties
lines[0].set(color='green', linewidth=2)
lines[0].set_linestyle(':')
lines[0].set_marker('s')
lines[0].set_markersize(10)

# Accessing the modified properties of the Line2D artist
print('\nModified properties of the Line2D artist:')
print('Color:', ax.get_lines()[0].get_color())
print('Line Style:', ax.get_lines()[0].get_linestyle())
print('Marker Size:', ax.get_lines()[0].get_markersize())
輸出
執行上述程式碼後,我們將得到以下輸出:
Initial properties of the Line2D artist:
Color: #1f77b4
Line Style: -
Marker Size: 6.0

Modified properties of the Line2D artist:
Color: green
Line Style: :
Marker Size: 10.0
操作藝術家資料
除了樣式屬性之外,藝術家還可以包含資料。例如,Line2D 物件具有可以使用set_data()方法修改的資料屬性。
示例
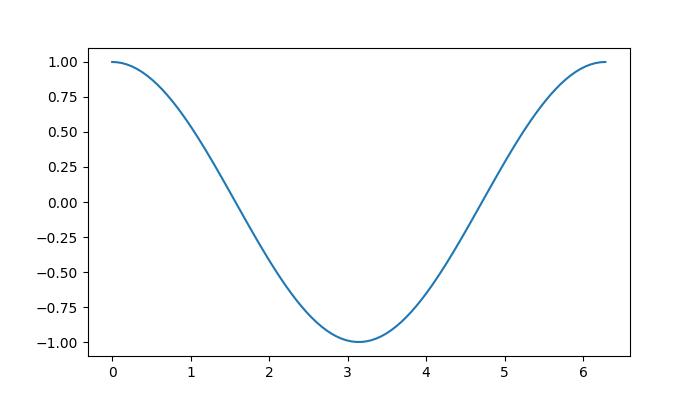
這是一個操作藝術家資料的示例。
import matplotlib.pyplot as plt
import numpy as np

# Creating a simple plot
fig, ax = plt.subplots(figsize=(7, 4))
x = np.linspace(0, 2 * np.pi, 100)

# Initial sinusoidal curve
y = np.sin(x)

# Use the plot method to create a Line2D artist a sinusoidal curve
lines = ax.plot(x, y)

# Modifying the artist data with the cosine
lines[0].set_data([x, np.cos(x)])

# Displaying the plot
plt.show()
輸出
執行上述程式碼後,我們將得到以下輸出:
手動新增藝術家
雖然許多藝術家都有輔助方法,但在某些情況下需要手動新增。例如,可以透過使用add_artist()方法將圓形或矩形等補丁直接新增到 Axes 物件。
示例
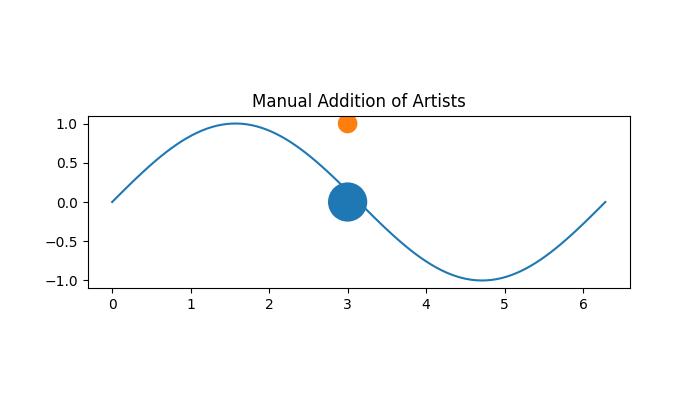
在這個例子中,我們手動將圓形補丁新增到軸。
import matplotlib.pyplot as plt
import numpy as np
import matplotlib.patches as mpatches

# Creating a simple plot
fig, ax = plt.subplots(figsize=(7, 4))
x = np.linspace(0, 2 * np.pi, 100)

# Initial sinusoidal curve
y = np.sin(x)

# Use the plot method to create a Line2D artist for a sinusoidal curve
lines = ax.plot(x, y)

# Adding a circle
circle = mpatches.Circle((3, 0), 0.25, ec="none")
ax.add_artist(circle)

# Adding another clipped circle
clipped_circle = mpatches.Circle((3, 1), 0.125, ec="none", facecolor='C1')
ax.add_artist(clipped_circle)
ax.set_aspect(1)

# Adding a title to the plot
plt.title('Manual Addition of Artists')

# Displaying the plot
plt.show()
輸出
執行上述程式碼後,我們將得到以下輸出:
移除藝術家
Matplotlib 提供了一種靈活的方法來從繪圖中移除特定的藝術家。藝術家的remove()方法允許從其 Axes 列表中移除藝術家。
示例
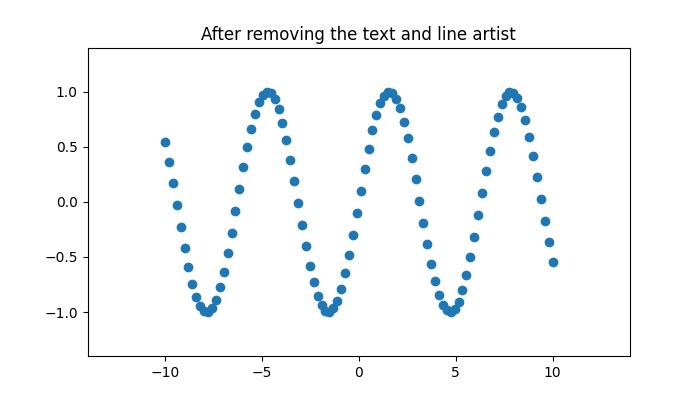
這是一個演示如何從繪圖中移除特定藝術家(Line2D 和文字)的示例。
import numpy as np
import matplotlib.pyplot as plt

# Create the figure
fig, ax = plt.subplots(figsize=(7, 4))
x = np.linspace(-10, 10, 100)
y = np.sin(x)

# plot the scatter plot
scat = ax.scatter(x, y)

# Assign the another Line2D artist to line_2
line_2 = plt.plot(x, np.cos(x), linestyle='dashed')

plt.margins(0.2)
plt.title("After removing the text and line artist")

text = fig.text(0.5, 0.96, "$y=sin(x)$")

# Remove the line_2 artist
l = line_2.pop(0)
l.remove()

# Remove the text artist
text.remove()

# Displaying the plot
plt.show()
輸出
執行上述程式碼後,你將得到以下輸出: