- Matplotlib 基礎
- Matplotlib - 首頁
- Matplotlib - 簡介
- Matplotlib - 與 Seaborn 的比較
- Matplotlib - 環境搭建
- Matplotlib - Anaconda 發行版
- Matplotlib - Jupyter Notebook
- Matplotlib - Pyplot API
- Matplotlib - 簡單繪圖
- Matplotlib - 儲存圖形
- Matplotlib - 標記
- Matplotlib - 圖形
- Matplotlib - 樣式
- Matplotlib - 圖例
- Matplotlib - 顏色
- Matplotlib - 顏色圖
- Matplotlib - 顏色圖歸一化
- Matplotlib - 選擇顏色圖
- Matplotlib - 顏色條
- Matplotlib - 文字
- Matplotlib - 文字屬性
- Matplotlib - 子圖示題
- Matplotlib - 圖片
- Matplotlib - 圖片蒙版
- Matplotlib - 註釋
- Matplotlib - 箭頭
- Matplotlib - 字型
- Matplotlib - 什麼是字型?
- 全域性設定字型屬性
- Matplotlib - 字型索引
- Matplotlib - 字型屬性
- Matplotlib - 刻度
- Matplotlib - 線性和對數刻度
- Matplotlib - 對稱對數和 Logit 刻度
- Matplotlib - LaTeX
- Matplotlib - 什麼是 LaTeX?
- Matplotlib - 用於數學表示式的 LaTeX
- Matplotlib - 註釋中的 LaTeX 文字格式
- Matplotlib - PostScript
- 啟用註釋中的 LaTeX 渲染
- Matplotlib - 數學表示式
- Matplotlib - 動畫
- Matplotlib - 圖形物件
- Matplotlib - 使用 Cycler 進行樣式設定
- Matplotlib - 路徑
- Matplotlib - 路徑效果
- Matplotlib - 變換
- Matplotlib - 刻度和刻度標籤
- Matplotlib - 弧度刻度
- Matplotlib - 日期刻度
- Matplotlib - 刻度格式化器
- Matplotlib - 刻度定位器
- Matplotlib - 基本單位
- Matplotlib - 自動縮放
- Matplotlib - 反轉座標軸
- Matplotlib - 對數座標軸
- Matplotlib - Symlog
- Matplotlib - 單位處理
- Matplotlib - 帶單位的橢圓
- Matplotlib - 脊柱
- Matplotlib - 座標軸範圍
- Matplotlib - 座標軸刻度
- Matplotlib - 座標軸刻度
- Matplotlib - 格式化座標軸
- Matplotlib - Axes 類
- Matplotlib - 雙座標軸
- Matplotlib - Figure 類
- Matplotlib - 多圖
- Matplotlib - 網格
- Matplotlib - 面向物件介面
- Matplotlib - PyLab 模組
- Matplotlib - Subplots() 函式
- Matplotlib - Subplot2grid() 函式
- Matplotlib - 固定位置的圖形物件
- Matplotlib - 手動等高線
- Matplotlib - 座標報告
- Matplotlib - AGG 濾鏡
- Matplotlib - 帶狀框
- Matplotlib - 填充螺旋線
- Matplotlib - Findobj 演示
- Matplotlib - 超連結
- Matplotlib - 圖片縮圖
- Matplotlib - 使用關鍵字繪圖
- Matplotlib - 建立 Logo
- Matplotlib - 多頁 PDF
- Matplotlib - 多程序
- Matplotlib - 列印標準輸出
- Matplotlib - 複合路徑
- Matplotlib - Sankey 類
- Matplotlib - MRI 與 EEG
- Matplotlib - 樣式表
- Matplotlib - 背景顏色
- Matplotlib - Basemap
- Matplotlib 事件處理
- Matplotlib - 事件處理
- Matplotlib - 關閉事件
- Matplotlib - 滑鼠移動
- Matplotlib - 點選事件
- Matplotlib - 滾動事件
- Matplotlib - 按鍵事件
- Matplotlib - 選擇事件
- Matplotlib - 透視鏡
- Matplotlib - 路徑編輯器
- Matplotlib - 多邊形編輯器
- Matplotlib - 定時器
- Matplotlib - Viewlims
- Matplotlib - 縮放視窗
- Matplotlib 小部件
- Matplotlib - 游標小部件
- Matplotlib - 帶註釋的游標
- Matplotlib - 按鈕小部件
- Matplotlib - 複選框
- Matplotlib - 套索選擇器
- Matplotlib - 選單小部件
- Matplotlib - 滑鼠游標
- Matplotlib - 多游標
- Matplotlib - 多邊形選擇器
- Matplotlib - 單選按鈕
- Matplotlib - 範圍滑塊
- Matplotlib - 矩形選擇器
- Matplotlib - 橢圓選擇器
- Matplotlib - 滑塊小部件
- Matplotlib - 跨度選擇器
- Matplotlib - 文字框
- Matplotlib 繪圖
- Matplotlib - 條形圖
- Matplotlib - 直方圖
- Matplotlib - 餅圖
- Matplotlib - 散點圖
- Matplotlib - 箱線圖
- Matplotlib - 小提琴圖
- Matplotlib - 等高線圖
- Matplotlib - 3D 繪圖
- Matplotlib - 3D 等高線
- Matplotlib - 3D 線框圖
- Matplotlib - 3D 曲面圖
- Matplotlib - 矢羽圖
- Matplotlib 有用資源
- Matplotlib - 快速指南
- Matplotlib - 有用資源
- Matplotlib - 討論
Matplotlib - AGG 濾鏡
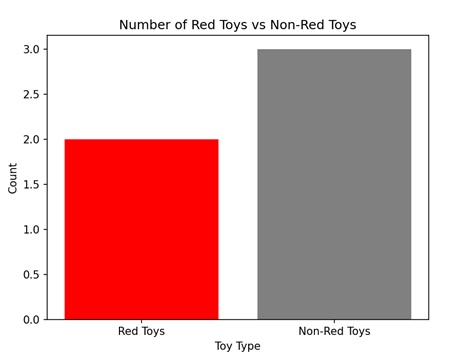
AGG 濾鏡,即“聚合濾鏡”,用於篩選大量資料,僅顯示滿足特定條件的資訊。想象一下,你有一個大盒子裝著玩具,你只想看到紅色的玩具。AGG 濾鏡可以幫助你快速找到並挑選出盒子裡的所有紅色玩具,而忽略其他的玩具。
Matplotlib 中的 AGG 濾鏡
在 Matplotlib 中,AGG 濾鏡,或抗鋸齒幾何濾鏡,用於在圖形元素(如線條、標記或文字)顯示在繪圖上之前對其應用某些變換。AGG 濾鏡允許我們修改繪圖中元素的外觀,例如調整其透明度、模糊它們或應用其他視覺效果。
可以使用 "FigureCanvasAgg()" 函式在 Matplotlib 中建立 AGG 濾鏡。此函式建立一個帶有 AGG 濾鏡的畫布,允許你顯示具有改進的質量和清晰度的繪圖和影像。
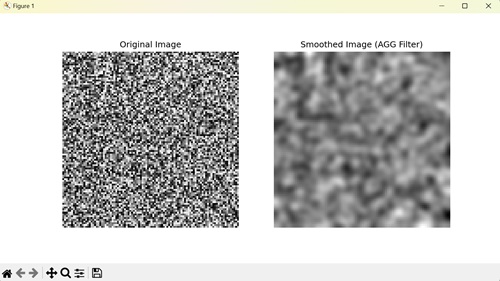
使用 AGG 濾鏡進行影像平滑
在 Matplotlib 中,使用 AGG 濾鏡進行影像平滑是一種用於模糊或軟化影像以減少噪聲的技術。AGG 濾鏡是用於影像平滑的可用選項之一,它將數學演算法應用於影像畫素,對相鄰畫素進行平均以建立更平滑的外觀。此過程有助於去除不均勻的邊緣並建立更具視覺吸引力的影像。
示例
在下面的示例中,我們使用 AGG 濾鏡進行影像平滑。我們首先生成一個隨機噪聲影像,然後使用 gaussian_filter() 函式應用高斯平滑。之後,我們建立一個 Matplotlib 圖形,其中包含兩個子圖,用於並排顯示原始影像和平滑後的影像。
import matplotlib.pyplot as plt
from matplotlib.backends.backend_agg import FigureCanvasAgg
import numpy as np
from scipy.ndimage import gaussian_filter

# Generating random noisy image
np.random.seed(0)
image = np.random.rand(100, 100)

# Applying Gaussian smoothing to the image
smoothed_image = gaussian_filter(image, sigma=2)

# Creating a figure and plot the original and smoothed images
fig, axs = plt.subplots(1, 2, figsize=(10, 5))

axs[0].imshow(image, cmap='gray')
axs[0].set_title('Original Image')

axs[1].imshow(smoothed_image, cmap='gray')
axs[1].set_title('Smoothed Image (AGG Filter)')

# Hiding the axes
for ax in axs:
   ax.axis('off')

# Saving the figure as an image file
canvas = FigureCanvasAgg(fig)
canvas.print_png('smoothed_image.png')

plt.show()
輸出
以下是上述程式碼的輸出:
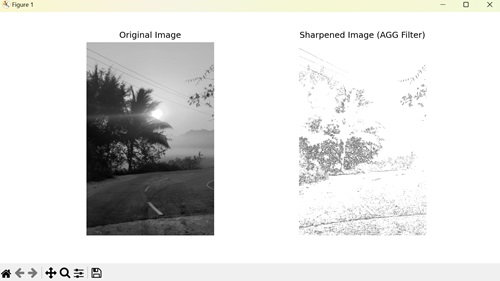
使用 AGG 濾鏡銳化影像
在 Matplotlib 中,使用 AGG 濾鏡銳化影像透過增加邊緣的對比度來增強影像的清晰度和細節。它涉及使用銳化核卷積影像,銳化核通常在中心具有正值,周圍環繞著負值。
示例
在這裡,我們使用 AGG 濾鏡進行影像銳化。我們首先載入影像,然後應用銳化濾鏡以增強影像的邊緣。這涉及定義銳化核並使用 scipy.ndimage.convolve() 函式將其與影像進行卷積。最後,我們顯示影像。
import matplotlib.pyplot as plt
from matplotlib.backends.backend_agg import FigureCanvasAgg
import numpy as np
from scipy.ndimage import convolve

# Loading an example image
image = plt.imread('sun.jpg')

# Converting to grayscale if image has multiple channels
if len(image.shape) > 2:
   image = image.mean(axis=2)

# Defining a sharpening kernel
kernel = np.array([[-1, -1, -1],
   [-1,  9, -1],
   [-1, -1, -1]])

# Applying the kernel to the image
sharpened_image = np.clip(convolve(image, kernel, mode='constant', cval=0.0), 0, 1)

# Creating a figure and plot the original and sharpened images
fig, axs = plt.subplots(1, 2, figsize=(10, 5))

axs[0].imshow(image, cmap='gray')
axs[0].set_title('Original Image')

axs[1].imshow(sharpened_image, cmap='gray')
axs[1].set_title('Sharpened Image (AGG Filter)')

# Hiding the axes
for ax in axs:
   ax.axis('off')

# Saving the figure as an image file
canvas = FigureCanvasAgg(fig)
canvas.print_png('sharpened_image.png')

plt.show()
輸出
執行上述程式碼後,我們將得到以下輸出:
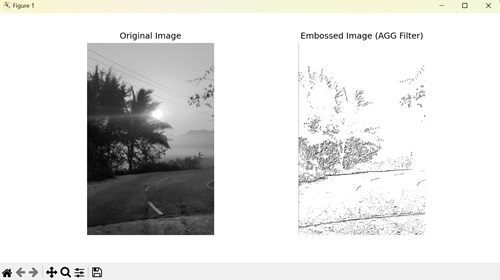
使用 AGG 濾鏡壓印影像
在 Matplotlib 中,使用 AGG 濾鏡壓印影像透過增強相鄰畫素之間的對比度來突出影像中的邊緣,從而使其具有三維外觀。它透過使用壓印核卷積影像來實現此效果,壓印核通常包含負值和正值。壓印影像通常具有凸起或凹陷的外觀,模擬衝壓或雕刻的效果。
示例
在下面的示例中,我們使用 AGG 濾鏡來壓印影像。我們首先載入一個示例影像,然後定義一個壓印核,這是一個旨在突出邊緣的特定矩陣。使用卷積將此核應用於影像會生成壓印影像。
import matplotlib.pyplot as plt
from matplotlib.backends.backend_agg import FigureCanvasAgg
import numpy as np
from scipy.ndimage import convolve

# Loading an example image
image = plt.imread('sun.jpg')

# Converting to grayscale if image has multiple channels
if len(image.shape) > 2:
   image = image.mean(axis=2)

# Defining an embossing kernel
kernel = np.array([[-2, -1, 0],
   [-1,  1, 1],
   [0, 1, 2]])

# Applying the kernel to the image
embossed_image = np.clip(convolve(image, kernel, mode='constant', cval=0.0), 0, 1)

# Creating a figure and plot the original and embossed images
fig, axs = plt.subplots(1, 2, figsize=(10, 5))

axs[0].imshow(image, cmap='gray')
axs[0].set_title('Original Image')

axs[1].imshow(embossed_image, cmap='gray')
axs[1].set_title('Embossed Image (AGG Filter)')

# Hiding the axes
for ax in axs:
   ax.axis('off')

# Saving the figure as an image file
canvas = FigureCanvasAgg(fig)
canvas.print_png('embossed_image.png')

plt.show()
輸出
執行上述程式碼後,我們將得到以下輸出: