- Matplotlib 基礎
- Matplotlib - 首頁
- Matplotlib - 簡介
- Matplotlib - 與 Seaborn 的對比
- Matplotlib - 環境設定
- Matplotlib - Anaconda 發行版
- Matplotlib - Jupyter Notebook
- Matplotlib - Pyplot API
- Matplotlib - 簡單繪圖
- Matplotlib - 儲存圖形
- Matplotlib - 標記
- Matplotlib - 圖形
- Matplotlib - 樣式
- Matplotlib - 圖例
- Matplotlib - 顏色
- Matplotlib - 色圖
- Matplotlib - 色圖歸一化
- Matplotlib - 選擇色圖
- Matplotlib - 色標
- Matplotlib - 文字
- Matplotlib - 文字屬性
- Matplotlib - 子圖示題
- Matplotlib - 影像
- Matplotlib - 影像遮罩
- Matplotlib - 註釋
- Matplotlib - 箭頭
- Matplotlib - 字型
- Matplotlib - 什麼是字型?
- 全域性設定字型屬性
- Matplotlib - 字型索引
- Matplotlib - 字型屬性
- Matplotlib - 刻度
- Matplotlib - 線性和對數刻度
- Matplotlib - 對稱對數和 Logit 刻度
- Matplotlib - LaTeX
- Matplotlib - 什麼是 LaTeX?
- Matplotlib - LaTeX 用於數學表示式
- Matplotlib - LaTeX 在註釋中的文字格式化
- Matplotlib - PostScript
- 在註釋中啟用 LaTeX 渲染
- Matplotlib - 數學表示式
- Matplotlib - 動畫
- Matplotlib - 圖元
- Matplotlib - 使用 Cycler 進行樣式設定
- Matplotlib - 路徑
- Matplotlib - 路徑效果
- Matplotlib - 變換
- Matplotlib - 刻度和刻度標籤
- Matplotlib - 弧度刻度
- Matplotlib - 日期刻度
- Matplotlib - 刻度格式化器
- Matplotlib - 刻度定位器
- Matplotlib - 基本單位
- Matplotlib - 自動縮放
- Matplotlib - 反轉軸
- Matplotlib - 對數軸
- Matplotlib - Symlog
- Matplotlib - 單位處理
- Matplotlib - 帶單位的橢圓
- Matplotlib - 脊柱
- Matplotlib - 軸範圍
- Matplotlib - 軸刻度
- Matplotlib - 軸刻度
- Matplotlib - 格式化軸
- Matplotlib - Axes 類
- Matplotlib - 雙軸
- Matplotlib - Figure 類
- Matplotlib - 多圖
- Matplotlib - 網格
- Matplotlib - 面向物件介面
- Matplotlib - PyLab 模組
- Matplotlib - Subplots() 函式
- Matplotlib - Subplot2grid() 函式
- Matplotlib - 固定圖元
- Matplotlib - 手動等值線
- Matplotlib - 座標報告
- Matplotlib - AGG 過濾器
- Matplotlib - 帶狀框
- Matplotlib - 填充螺旋線
- Matplotlib - Findobj 演示
- Matplotlib - 超連結
- Matplotlib - 影像縮圖
- Matplotlib - 使用關鍵字繪圖
- Matplotlib - 建立 Logo
- Matplotlib - 多頁 PDF
- Matplotlib - 多處理
- Matplotlib - 列印標準輸出
- Matplotlib - 複合路徑
- Matplotlib - Sankey 類
- Matplotlib - MRI 與 EEG
- Matplotlib - 樣式表
- Matplotlib - 背景顏色
- Matplotlib - Basemap
- Matplotlib 事件處理
- Matplotlib - 事件處理
- Matplotlib - 關閉事件
- Matplotlib - 滑鼠移動
- Matplotlib - 點選事件
- Matplotlib - 滾動事件
- Matplotlib - 按鍵事件
- Matplotlib - 選擇事件
- Matplotlib - 觀察鏡
- Matplotlib - 路徑編輯器
- Matplotlib - 多邊形編輯器
- Matplotlib - 定時器
- Matplotlib - Viewlims
- Matplotlib - 縮放視窗
- Matplotlib 小部件
- Matplotlib - 游標小部件
- Matplotlib - 帶註釋的游標
- Matplotlib - 按鈕小部件
- Matplotlib - 複選框
- Matplotlib - 套索選擇器
- Matplotlib - 選單小部件
- Matplotlib - 滑鼠游標
- Matplotlib - 多游標
- Matplotlib - 多邊形選擇器
- Matplotlib - 單選按鈕
- Matplotlib - 範圍滑塊
- Matplotlib - 矩形選擇器
- Matplotlib - 橢圓選擇器
- Matplotlib - 滑塊小部件
- Matplotlib - 跨度選擇器
- Matplotlib - 文字框
- Matplotlib 繪圖
- Matplotlib - 條形圖
- Matplotlib - 直方圖
- Matplotlib - 餅圖
- Matplotlib - 散點圖
- Matplotlib - 箱線圖
- Matplotlib - 小提琴圖
- Matplotlib - 等值線圖
- Matplotlib - 3D 繪圖
- Matplotlib - 3D 等值線
- Matplotlib - 3D 線框圖
- Matplotlib - 3D 表面圖
- Matplotlib - Quiver 圖
- Matplotlib 有用資源
- Matplotlib - 快速指南
- Matplotlib - 有用資源
- Matplotlib - 討論
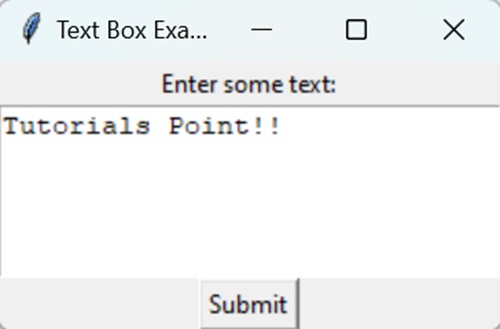
Matplotlib - 文字框
文字框是文件或螢幕上可以鍵入或顯示文字的區域。它就像一個小盒子,您可以在其中輸入或輸出單詞、句子或段落。可以這樣理解:
輸入文字框 - 當您在表單或網站上看到一個空白區域,可以在其中鍵入您的姓名、電子郵件或任何其他資訊時,那就是一個文字框。您可以點選它並開始鍵入。
輸出文字框 - 當您在網頁或文件的某個部分看到顯示文字時,例如訊息或描述,那也是一個文字框。它只是顯示文字,而不是允許您在其中鍵入。
Matplotlib 中的文字框
在 Matplotlib 中,文字框是一個圖形元素,用於在繪圖中顯示文字,提供其他資訊或註釋。它允許您直接在繪圖上包含描述性文字、標籤或解釋。
您可以使用 text() 函式在 Matplotlib 中建立文字框。在 Matplotlib 中,用於建立文字框的函式是 plt.text()。此函式允許您將文字直接新增到繪圖中,指定文字內容及其在繪圖中的位置。此外,您可以自定義文字框的各種屬性,例如字型樣式、大小、顏色、對齊方式和背景顏色,以滿足其視覺化需求。
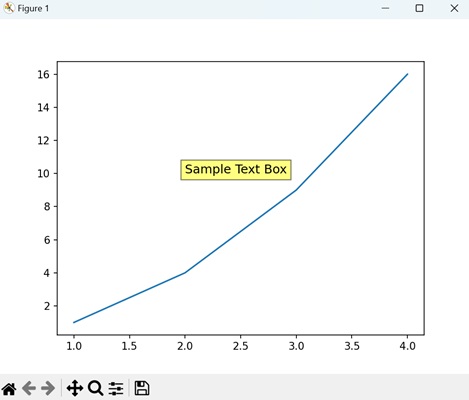
基本文字框
Matplotlib 中的基本文字框是在繪圖中新增文字的一種簡單方法。它允許您將標籤或註釋直接新增到繪圖上。您可以使用 text() 函式指定文字的內容及其在繪圖中的位置。
示例
在下面的示例中,我們正在建立一個基本文字框,文字為“Sample Text Box”,位於繪圖上的 (2, 10) 座標處:
import matplotlib.pyplot as plt

# Creating a plot
plt.plot([1, 2, 3, 4], [1, 4, 9, 16])

# Adding a basic text box
plt.text(2, 10, 'Sample Text Box', fontsize=12, bbox=dict(facecolor='yellow', alpha=0.5))

# Displaying the plot
plt.show()
輸出
以下是上述程式碼的輸出:
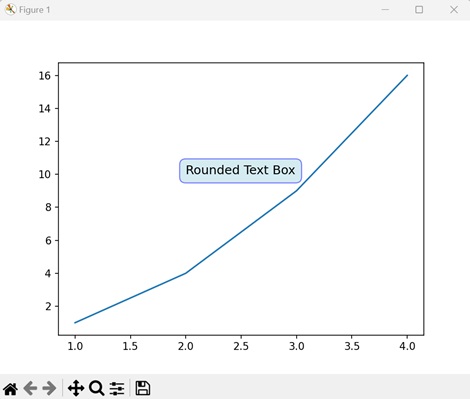
圓角文字框
Matplotlib 中的圓角文字框是基本文字框的一種變體,具有圓角。它允許您在矩形框內向繪圖新增文字,但具有圓滑的角。
示例
在這裡,我們正在建立一個圓角文字框,文字為“Rounded Text Box”,位於繪圖上的 (2, 10) 座標處:
import matplotlib.pyplot as plt

# Creating a plot
plt.plot([1, 2, 3, 4], [1, 4, 9, 16])

# Adding a rounded text box
plt.text(2, 10, 'Rounded Text Box', fontsize=12, bbox=dict(facecolor='lightblue', alpha=0.5, edgecolor='blue', boxstyle='round,pad=0.5'))

# Displaying the plot
plt.show()
輸出
執行上述程式碼後,我們將得到以下輸出:
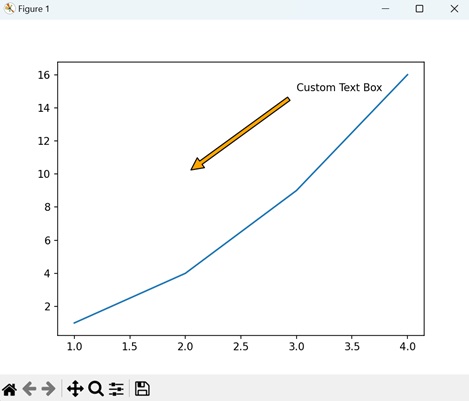
帶箭頭的自定義文字框
Matplotlib 中帶箭頭的自定義文字框是一種特殊的註釋型別,它將文字框與指向繪圖上特定位置的箭頭結合起來。這是一種在繪圖中引起對特定特徵或資料點的注意的方法。
示例
以下示例建立一個帶箭頭的自定義文字框,指向繪圖上 (2, 10) 座標處的“Custom Text Box”文字:
import matplotlib.pyplot as plt

# Creating a plot
plt.plot([1, 2, 3, 4], [1, 4, 9, 16])

# Adding a custom text box with arrow
plt.annotate('Custom Text Box', xy=(2, 10), xytext=(3, 15),
   arrowprops=dict(facecolor='orange', shrink=0.05))

# Displaying the plot
plt.show()
輸出
執行上述程式碼後,我們將得到以下輸出:
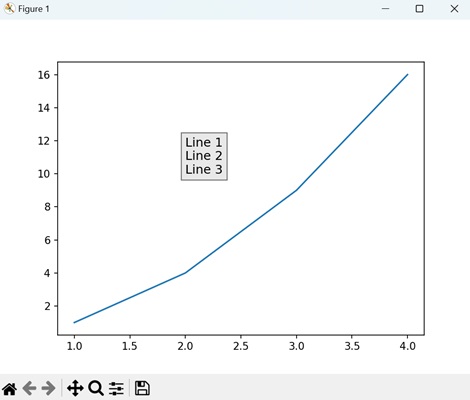
多行文字框
在 Matplotlib 中,多行文字框允許您在繪圖上的單個註釋框中包含多行文字。此功能對於新增跨越多行的較長解釋、描述或標籤很有用。
示例
現在,我們正在建立一個多行文字框,其中包含三行文字,位於繪圖上的 (2, 10) 座標處。我們用“\n”分隔每一行:
import matplotlib.pyplot as plt

# Creating a plot
plt.plot([1, 2, 3, 4], [1, 4, 9, 16])

# Adding a multiline text box
plt.text(2, 10, 'Line 1\nLine 2\nLine 3', fontsize=12, bbox=dict(facecolor='lightgrey', alpha=0.5))

# Displaying the plot
plt.show()
輸出
執行上述程式碼後,我們將得到以下輸出: