- Matplotlib 基礎
- Matplotlib - 首頁
- Matplotlib - 簡介
- Matplotlib - 與 Seaborn 的比較
- Matplotlib - 環境設定
- Matplotlib - Anaconda 發行版
- Matplotlib - Jupyter Notebook
- Matplotlib - Pyplot API
- Matplotlib - 簡單繪圖
- Matplotlib - 儲存圖形
- Matplotlib - 標記
- Matplotlib - 圖形
- Matplotlib - 樣式
- Matplotlib - 圖例
- Matplotlib - 顏色
- Matplotlib - 顏色圖
- Matplotlib - 顏色圖歸一化
- Matplotlib - 選擇顏色圖
- Matplotlib - 顏色條
- Matplotlib - 文字
- Matplotlib - 文字屬性
- Matplotlib - 子圖示題
- Matplotlib - 圖片
- Matplotlib - 圖片蒙版
- Matplotlib - 註釋
- Matplotlib - 箭頭
- Matplotlib - 字型
- Matplotlib - 什麼是字型?
- 全域性設定字型屬性
- Matplotlib - 字型索引
- Matplotlib - 字型屬性
- Matplotlib - 比例尺
- Matplotlib - 線性與對數比例尺
- Matplotlib - 對稱對數與Logit比例尺
- Matplotlib - LaTeX
- Matplotlib - 什麼是LaTeX?
- Matplotlib - 用於數學表示式的LaTeX
- Matplotlib - 註釋中的LaTeX文字格式
- Matplotlib - PostScript
- 啟用註釋中的LaTex渲染
- Matplotlib - 數學表示式
- Matplotlib - 動畫
- Matplotlib - 繪圖元素
- Matplotlib - 使用Cycler進行樣式設定
- Matplotlib - 路徑
- Matplotlib - 路徑效果
- Matplotlib - 變換
- Matplotlib - 刻度和刻度標籤
- Matplotlib - 弧度刻度
- Matplotlib - 日期刻度
- Matplotlib - 刻度格式化器
- Matplotlib - 刻度定位器
- Matplotlib - 基本單位
- Matplotlib - 自動縮放
- Matplotlib - 反轉座標軸
- Matplotlib - 對數座標軸
- Matplotlib - Symlog
- Matplotlib - 單位處理
- Matplotlib - 帶單位的橢圓
- Matplotlib - 脊柱
- Matplotlib - 座標軸範圍
- Matplotlib - 座標軸比例尺
- Matplotlib - 座標軸刻度
- Matplotlib - 座標軸格式化
- Matplotlib - Axes 類
- Matplotlib - 雙座標軸
- Matplotlib - Figure 類
- Matplotlib - 多圖
- Matplotlib - 網格
- Matplotlib - 面向物件介面
- Matplotlib - PyLab 模組
- Matplotlib - Subplots() 函式
- Matplotlib - Subplot2grid() 函式
- Matplotlib - 固定位置的繪圖元素
- Matplotlib - 手動等值線
- Matplotlib - 座標報告
- Matplotlib - AGG 濾鏡
- Matplotlib - 飄帶框
- Matplotlib - 填充螺旋線
- Matplotlib - Findobj 演示
- Matplotlib - 超連結
- Matplotlib - 圖片縮圖
- Matplotlib - 使用關鍵字繪圖
- Matplotlib - 建立Logo
- Matplotlib - 多頁PDF
- Matplotlib - 多程序
- Matplotlib - 列印標準輸出
- Matplotlib - 複合路徑
- Matplotlib - Sankey 類
- Matplotlib - MRI 與 EEG
- Matplotlib - 樣式表
- Matplotlib - 背景顏色
- Matplotlib - Basemap
- Matplotlib 事件處理
- Matplotlib - 事件處理
- Matplotlib - 關閉事件
- Matplotlib - 滑鼠移動
- Matplotlib - 點選事件
- Matplotlib - 滾動事件
- Matplotlib - 按鍵事件
- Matplotlib - 選擇事件
- Matplotlib - 透視鏡
- Matplotlib - 路徑編輯器
- Matplotlib - 多邊形編輯器
- Matplotlib - 定時器
- Matplotlib - Viewlims
- Matplotlib - 縮放視窗
- Matplotlib 控制元件
- Matplotlib - 游標控制元件
- Matplotlib - 帶註釋的游標
- Matplotlib - 按鈕控制元件
- Matplotlib - 複選框
- Matplotlib - 套索選擇器
- Matplotlib - 選單控制元件
- Matplotlib - 滑鼠游標
- Matplotlib - 多游標
- Matplotlib - 多邊形選擇器
- Matplotlib - 單選按鈕
- Matplotlib - 範圍滑塊
- Matplotlib - 矩形選擇器
- Matplotlib - 橢圓選擇器
- Matplotlib - 滑塊控制元件
- Matplotlib - 區間選擇器
- Matplotlib - 文字框
- Matplotlib 繪圖
- Matplotlib - 條形圖
- Matplotlib - 直方圖
- Matplotlib - 餅圖
- Matplotlib - 散點圖
- Matplotlib - 箱線圖
- Matplotlib - 小提琴圖
- Matplotlib - 等值線圖
- Matplotlib - 3D 繪圖
- Matplotlib - 3D 等值線
- Matplotlib - 3D 線框圖
- Matplotlib - 3D 表面圖
- Matplotlib - 矢羽圖
- Matplotlib 有用資源
- Matplotlib - 快速指南
- Matplotlib - 有用資源
- Matplotlib - 討論
Matplotlib - 橢圓選擇器
簡介
Matplotlib 沒有直接內建的橢圓選擇器控制元件,但我們可以透過使用 Matplotlib 的事件處理功能實現自定義橢圓選擇器來實現類似的功能。
橢圓選擇器的概念
橢圓選擇器是一個互動式工具,允許使用者繪製並選擇橢圓區域內的 資料點。此工具在探索資料集或影像並希望關注由橢圓定義的特定感興趣區域時特別有用。
橢圓選擇器的關鍵特徵
以下是橢圓選擇器的關鍵特徵。
互動式選擇 - 橢圓選擇器允許使用者在繪圖中互動式地定義和修改橢圓區域。這對於選擇資料視覺化中特定感興趣的區域非常有價值。
動態更新 - 當用戶拖動或調整橢圓大小,所選區域會動態更新。即時反饋增強了使用者體驗並允許精確選擇。
與繪圖整合 - 橢圓選擇器通常整合到 Matplotlib 繪圖中,使使用者能夠在選定的橢圓內目視檢查和互動式地處理資料點。
實現方法
建立橢圓選擇器涉及捕獲滑鼠事件以定義和更新橢圓區域。以下是兩種在 Matplotlib 中實現橢圓選擇器的潛在方法。
使用 matplotlib.patches.Ellipse
我們可以利用 Matplotlib 中的Ellipse補丁來直觀地表示橢圓選擇器。其思想是處理滑鼠事件以定義橢圓的中心、寬度、高度和旋轉。
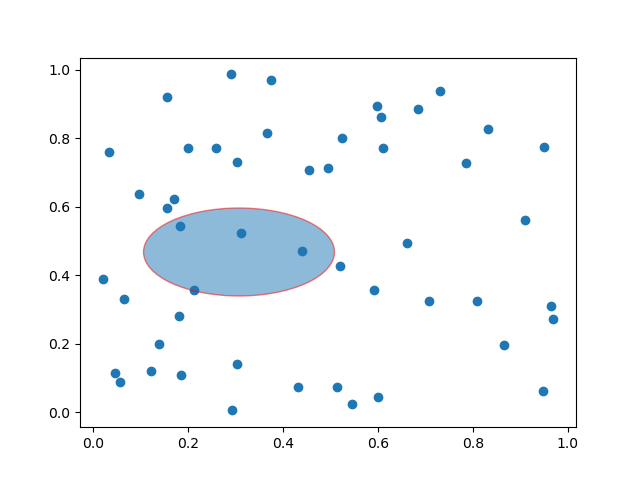
示例
import matplotlib.pyplot as plt
from matplotlib.patches import Ellipse

class EllipseSelector:
   def __init__(self, ax):
      self.ax = ax
      self.ellipse = None
      self.cid_press = ax.figure.canvas.mpl_connect('button_press_event', self.on_press)
      self.cid_release = ax.figure.canvas.mpl_connect('button_release_event', self.on_release)
      self.cid_motion = ax.figure.canvas.mpl_connect('motion_notify_event', self.on_motion)

   def on_press(self, event):
      if event.inaxes == self.ax:
         center = (event.xdata, event.ydata)
         self.ellipse = Ellipse(center, 1, 1, edgecolor='red', alpha=0.5)
         self.ax.add_patch(self.ellipse)

   def on_release(self, event):
      self.ellipse = None

   def on_motion(self, event):
      if self.ellipse:
         width = event.xdata - self.ellipse.center[0]
         height = event.ydata - self.ellipse.center[1]
         self.ellipse.width = width
         self.ellipse.height = height
         self.ax.figure.canvas.draw()

# Create a scatter plot with random data
np.random.seed(42)
x_data = np.random.rand(50)
y_data = np.random.rand(50)

fig, ax = plt.subplots()
ax.scatter(x_data, y_data)

# Initialize the EllipseSelector
ellipse_selector = EllipseSelector(ax)

plt.show()
輸出
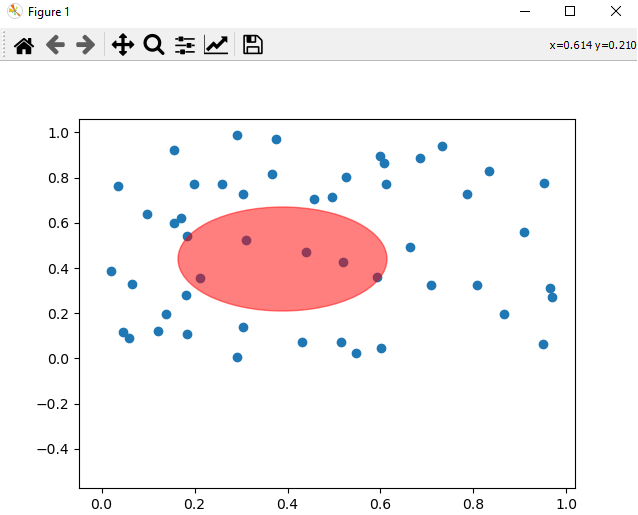
使用 matplotlib.widgets(自定義控制元件)
另一種方法是使用matplotlib.widgets建立一個自定義控制元件來封裝橢圓選擇器的邏輯。這種方法可能提供更模組化的解決方案。
示例
import matplotlib.pyplot as plt
from matplotlib.widgets import EllipseSelector
import numpy as np

# Function to be triggered when the ellipse is selected
def on_select(eclick, erelease):
   print(f"Selected Ellipse: Center={eclick.xdata, eclick.ydata}, Width={abs(erelease.xdata - eclick.xdata)}, Height={abs(erelease.ydata - eclick.ydata)}")

# Create a scatter plot with random data
np.random.seed(42)
x_data = np.random.rand(50)
y_data = np.random.rand(50)

fig, ax = plt.subplots()
ax.scatter(x_data, y_data)

# Create Ellipse Selector
ellipse_selector = EllipseSelector(ax, on_select, props=dict(facecolor='red', edgecolor='red', alpha=0.5))

plt.show()
輸出
Selected Ellipse: Center=(0.17951154118643367, 0.2584893480158592), Width=0.3678226677251435, Height=0.5797088949246063
用例和注意事項
以下是橢圓選擇器控制元件的用例和注意事項。
資料區域選擇 - 橢圓選擇器可用於選擇散點圖或其他型別的資料視覺化中的特定感興趣區域。
資料分析 - 使用者可以使用橢圓選擇器在選定的橢圓區域內直觀地分析和解釋資料點的模式或叢集。
與回撥函式整合 - 為了增強功能,橢圓選擇器可以與回撥函式相關聯,這些回撥函式會響應選擇。例如,我們可以根據橢圓內的 資料點執行操作。
視覺探索 - 橢圓選擇器的互動性允許使用者透過幫助理解複雜資料集來動態地探索和細化他們的選擇。
最後,我們可以說,由於 Matplotlib 沒有專門的橢圓選擇器控制元件,因此可以使用現有的 Matplotlib 元件建立自定義橢圓選擇器。提供的示例演示了實現橢圓選擇器的兩種潛在方法。透過捕獲滑鼠事件並相應地更新橢圓的屬性,我們可以建立一個互動式工具,用於在 Matplotlib 繪圖中選擇和探索資料。