- Matplotlib 基礎
- Matplotlib - 首頁
- Matplotlib - 簡介
- Matplotlib - 與 Seaborn 的對比
- Matplotlib - 環境設定
- Matplotlib - Anaconda 發行版
- Matplotlib - Jupyter Notebook
- Matplotlib - Pyplot API
- Matplotlib - 簡單繪圖
- Matplotlib - 儲存圖形
- Matplotlib - 標記
- Matplotlib - 圖形
- Matplotlib - 樣式
- Matplotlib - 圖例
- Matplotlib - 顏色
- Matplotlib - 顏色圖
- Matplotlib - 顏色圖歸一化
- Matplotlib - 選擇顏色圖
- Matplotlib - 色標
- Matplotlib - 文字
- Matplotlib - 文字屬性
- Matplotlib - 子圖示題
- Matplotlib - 影像
- Matplotlib - 影像蒙版
- Matplotlib - 註釋
- Matplotlib - 箭頭
- Matplotlib - 字型
- Matplotlib - 什麼是字型?
- 全域性設定字型屬性
- Matplotlib - 字型索引
- Matplotlib - 字型屬性
- Matplotlib - 刻度
- Matplotlib - 線性與對數刻度
- Matplotlib - 對稱對數與 Logit 刻度
- Matplotlib - LaTeX
- Matplotlib - 什麼是 LaTeX?
- Matplotlib - LaTeX 用於數學表示式
- Matplotlib - LaTeX 在註釋中的文字格式化
- Matplotlib - PostScript
- 在註釋中啟用 LaTeX 渲染
- Matplotlib - 數學表示式
- Matplotlib - 動畫
- Matplotlib - 圖形物件
- Matplotlib - 使用 Cycler 進行樣式設定
- Matplotlib - 路徑
- Matplotlib - 路徑效果
- Matplotlib - 轉換
- Matplotlib - 刻度和刻度標籤
- Matplotlib - 弧度刻度
- Matplotlib - 日期刻度
- Matplotlib - 刻度格式化器
- Matplotlib - 刻度定位器
- Matplotlib - 基本單位
- Matplotlib - 自動縮放
- Matplotlib - 反轉座標軸
- Matplotlib - 對數座標軸
- Matplotlib - Symlog
- Matplotlib - 單位處理
- Matplotlib - 帶單位的橢圓
- Matplotlib - 脊柱
- Matplotlib - 座標軸範圍
- Matplotlib - 座標軸刻度
- Matplotlib - 座標軸刻度
- Matplotlib - 格式化座標軸
- Matplotlib - Axes 類
- Matplotlib - 雙座標軸
- Matplotlib - Figure 類
- Matplotlib - 多圖
- Matplotlib - 網格
- Matplotlib - 面向物件介面
- Matplotlib - PyLab 模組
- Matplotlib - Subplots() 函式
- Matplotlib - Subplot2grid() 函式
- Matplotlib - 固定圖形物件
- Matplotlib - 手動等值線
- Matplotlib - 座標報告
- Matplotlib - AGG 過濾器
- Matplotlib - 帶狀框
- Matplotlib - 填充螺旋線
- Matplotlib - Findobj 演示
- Matplotlib - 超連結
- Matplotlib - 影像縮圖
- Matplotlib - 使用關鍵字繪圖
- Matplotlib - 建立 Logo
- Matplotlib - 多頁 PDF
- Matplotlib - 多程序
- Matplotlib - 列印標準輸出
- Matplotlib - 複合路徑
- Matplotlib - Sankey 類
- Matplotlib - MRI 與 EEG
- Matplotlib - 樣式表
- Matplotlib - 背景顏色
- Matplotlib - Basemap
- Matplotlib 事件處理
- Matplotlib - 事件處理
- Matplotlib - 關閉事件
- Matplotlib - 滑鼠移動
- Matplotlib - 點選事件
- Matplotlib - 滾動事件
- Matplotlib - 按鍵事件
- Matplotlib - 選擇事件
- Matplotlib - 放大鏡
- Matplotlib - 路徑編輯器
- Matplotlib - 多邊形編輯器
- Matplotlib - 定時器
- Matplotlib - Viewlims
- Matplotlib - 縮放視窗
- Matplotlib 小部件
- Matplotlib - 遊標小部件
- Matplotlib - 帶註釋的遊標
- Matplotlib - 按鈕小部件
- Matplotlib - 複選框
- Matplotlib - 套索選擇器
- Matplotlib - 選單小部件
- Matplotlib - 滑鼠遊標
- Matplotlib - 多遊標
- Matplotlib - 多邊形選擇器
- Matplotlib - 單選按鈕
- Matplotlib - 範圍滑塊
- Matplotlib - 矩形選擇器
- Matplotlib - 橢圓選擇器
- Matplotlib - 滑塊小部件
- Matplotlib - 跨度選擇器
- Matplotlib - 文字框
- Matplotlib 繪圖
- Matplotlib - 條形圖
- Matplotlib - 直方圖
- Matplotlib - 餅圖
- Matplotlib - 散點圖
- Matplotlib - 箱線圖
- Matplotlib - 小提琴圖
- Matplotlib - 等值線圖
- Matplotlib - 3D 繪圖
- Matplotlib - 3D 等值線
- Matplotlib - 3D 線框圖
- Matplotlib - 3D 曲面圖
- Matplotlib - Quiver 圖
- Matplotlib 有用資源
- Matplotlib - 快速指南
- Matplotlib - 有用資源
- Matplotlib - 討論
Matplotlib - 樣式
什麼是 Matplotlib 中的樣式?
在 Matplotlib 庫中,樣式是允許我們輕鬆更改繪圖視覺外觀的配置。它們充當預定義的美學選擇集,透過更改顏色、線條樣式、字型、網格線等方面來實現。這些樣式有助於快速自定義繪圖的外觀和感覺,而無需每次都手動調整各個元素。
我們可以嘗試不同的樣式,以找到最適合我們的資料或視覺偏好的樣式。樣式提供了一種快速有效的方法來增強 Matplotlib 庫中繪圖的視覺呈現。
內建樣式
Matplotlib 帶有多種內建樣式,它們提供不同的配色方案、線條樣式、字型大小和其他視覺屬性。
例如:ggplot、seaborn、classic、dark_background 等。
更改樣式
使用 plt.style.use('style_name') 將特定樣式應用於我們的繪圖。Matplotlib 樣式的關鍵方面
預定義樣式 - Matplotlib 庫帶有各種內建樣式,為我們的繪圖提供不同的美學效果。
易用性 - 透過應用樣式,我們可以立即更改繪圖的整體外觀,以匹配不同的主題或視覺偏好。
一致性 - 樣式確保在同一樣式設定下的多個繪圖或圖形之間的一致性。
使用樣式
在 matlplotlib 庫中使用可用樣式涉及幾個步驟。讓我們一一看看它們。
設定樣式
為了設定所需的樣式,我們必須使用 plt.style.use('style_name') 在建立繪圖之前設定特定的樣式。
例如,如果我們想要設定 ggplot 樣式,我們必須使用以下程式碼。
import matplotlib.pyplot as plt
plt.style.use('ggplot')  # Setting the 'ggplot' style
可用樣式
我們可以使用 plt.style.available 檢視可用樣式的列表。
示例
import matplotlib.pyplot as plt
print(plt.style.available)  # Prints available styles
輸出
['Solarize_Light2', '_classic_test_patch', '_mpl-gallery', '_mpl-gallery-nogrid', 'bmh', 'classic', 'dark_background', 'fast', 'fivethirtyeight', 'ggplot', 'grayscale', 'seaborn', 'seaborn-bright', 'seaborn-colorblind', 'seaborn-dark', 'seaborn-dark-palette', 'seaborn-darkgrid', 'seaborn-deep', 'seaborn-muted', 'seaborn-notebook', 'seaborn-paper', 'seaborn-pastel', 'seaborn-poster', 'seaborn-talk', 'seaborn-ticks', 'seaborn-white', 'seaborn-whitegrid', 'tableau-colorblind10']
應用自定義樣式
我們可以建立包含特定配置的自定義樣式檔案,然後使用 plt.style.use('path_to_custom_style_file') 應用它們。
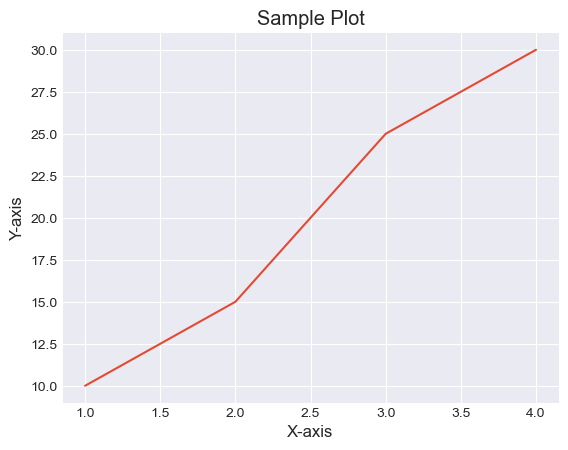
應用 seaborn-darkgrid 樣式
在此示例中,樣式 'seaborn-darkgrid' 應用於繪圖,從而改變其外觀。
示例
import matplotlib.pyplot as plt
# Using a specific style
plt.style.use('seaborn-darkgrid')

# Creating a sample plot
plt.plot([1, 2, 3, 4], [10, 15, 25, 30])
plt.xlabel('X-axis')
plt.ylabel('Y-axis')
plt.title('Sample Plot')
plt.show()
輸出
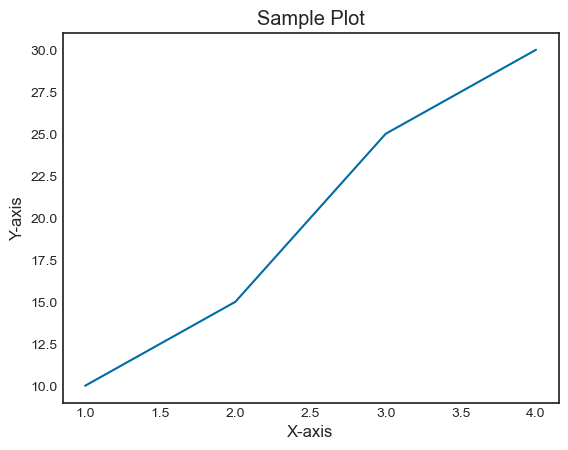
應用 ggplot 樣式
在此示例中,我們對繪圖使用 ggplot 樣式。
示例
import matplotlib.pyplot as plt
# Using a specific style
plt.style.use('seaborn-white')

# Creating a sample plot
plt.plot([1, 2, 3, 4], [10, 15, 25, 30])
plt.xlabel('X-axis')
plt.ylabel('Y-axis')
plt.title('Sample Plot')
plt.show()
輸出
廣告