- Matplotlib 基礎
- Matplotlib - 首頁
- Matplotlib - 簡介
- Matplotlib - 與 Seaborn 的對比
- Matplotlib - 環境搭建
- Matplotlib - Anaconda 發行版
- Matplotlib - Jupyter Notebook
- Matplotlib - Pyplot API
- Matplotlib - 簡單繪圖
- Matplotlib - 儲存圖形
- Matplotlib - 標記
- Matplotlib - 圖形
- Matplotlib - 樣式
- Matplotlib - 圖例
- Matplotlib - 顏色
- Matplotlib - 顏色對映
- Matplotlib - 顏色對映歸一化
- Matplotlib - 選擇顏色對映
- Matplotlib - 色標
- Matplotlib - 文字
- Matplotlib - 文字屬性
- Matplotlib - 子圖示題
- Matplotlib - 影像
- Matplotlib - 影像蒙版
- Matplotlib - 註釋
- Matplotlib - 箭頭
- Matplotlib - 字型
- Matplotlib - 什麼是字型?
- 全域性設定字型屬性
- Matplotlib - 字型索引
- Matplotlib - 字型屬性
- Matplotlib - 刻度
- Matplotlib - 線性和對數刻度
- Matplotlib - 對稱對數和 Logit 刻度
- Matplotlib - LaTeX
- Matplotlib - 什麼是 LaTeX?
- Matplotlib - 用於數學表示式的 LaTeX
- Matplotlib - 註釋中的 LaTeX 文字格式
- Matplotlib - PostScript
- 在註釋中啟用 LaTeX 渲染
- Matplotlib - 數學表示式
- Matplotlib - 動畫
- Matplotlib - 圖形物件
- Matplotlib - 使用 Cycler 進行樣式設定
- Matplotlib - 路徑
- Matplotlib - 路徑效果
- Matplotlib - 轉換
- Matplotlib - 刻度和刻度標籤
- Matplotlib - 弧度刻度
- Matplotlib - 日期刻度
- Matplotlib - 刻度格式化器
- Matplotlib - 刻度定位器
- Matplotlib - 基本單位
- Matplotlib - 自動縮放
- Matplotlib - 反轉軸
- Matplotlib - 對數軸
- Matplotlib - Symlog
- Matplotlib - 單位處理
- Matplotlib - 帶單位的橢圓
- Matplotlib - 脊柱
- Matplotlib - 軸範圍
- Matplotlib - 軸刻度
- Matplotlib - 軸刻度
- Matplotlib - 格式化軸
- Matplotlib - Axes 類
- Matplotlib - 雙軸
- Matplotlib - Figure 類
- Matplotlib - 多圖
- Matplotlib - 網格
- Matplotlib - 面向物件介面
- Matplotlib - PyLab 模組
- Matplotlib - Subplots() 函式
- Matplotlib - Subplot2grid() 函式
- Matplotlib - 固定圖形物件
- Matplotlib - 手動等值線
- Matplotlib - 座標報告
- Matplotlib - AGG 過濾器
- Matplotlib - 帶狀框
- Matplotlib - 填充螺旋線
- Matplotlib - Findobj 演示
- Matplotlib - 超連結
- Matplotlib - 影像縮圖
- Matplotlib - 使用關鍵字繪圖
- Matplotlib - 建立徽標
- Matplotlib - 多頁 PDF
- Matplotlib - 多程序
- Matplotlib - 列印標準輸出
- Matplotlib - 複合路徑
- Matplotlib - Sankey 類
- Matplotlib - MRI 與 EEG
- Matplotlib - 樣式表
- Matplotlib - 背景顏色
- Matplotlib - Basemap
- Matplotlib 事件處理
- Matplotlib - 事件處理
- Matplotlib - 關閉事件
- Matplotlib - 滑鼠移動
- Matplotlib - 點選事件
- Matplotlib - 滾動事件
- Matplotlib - 按鍵事件
- Matplotlib - 選擇事件
- Matplotlib - 放大鏡
- Matplotlib - 路徑編輯器
- Matplotlib - 多邊形編輯器
- Matplotlib - 定時器
- Matplotlib - Viewlims
- Matplotlib - 縮放視窗
- Matplotlib 小部件
- Matplotlib - 遊標小部件
- Matplotlib - 帶註釋的遊標
- Matplotlib - 按鈕小部件
- Matplotlib - 複選框
- Matplotlib - 套索選擇器
- Matplotlib - 選單小部件
- Matplotlib - 滑鼠遊標
- Matplotlib - 多遊標
- Matplotlib - 多邊形選擇器
- Matplotlib - 單選按鈕
- Matplotlib - 範圍滑塊
- Matplotlib - 矩形選擇器
- Matplotlib - 橢圓選擇器
- Matplotlib - 滑塊小部件
- Matplotlib - 跨度選擇器
- Matplotlib - 文字框
- Matplotlib 繪圖
- Matplotlib - 條形圖
- Matplotlib - 直方圖
- Matplotlib - 餅圖
- Matplotlib - 散點圖
- Matplotlib - 箱線圖
- Matplotlib - 小提琴圖
- Matplotlib - 等值線圖
- Matplotlib - 3D 繪圖
- Matplotlib - 3D 等值線
- Matplotlib - 3D 線框圖
- Matplotlib - 3D 曲面圖
- Matplotlib - Quiver 圖
- Matplotlib 有用資源
- Matplotlib - 快速指南
- Matplotlib - 有用資源
- Matplotlib - 討論
Matplotlib - 路徑編輯器
路徑編輯器是一個應用程式,允許使用者在圖形環境中互動式地編輯和操作路徑。在 Matplotlib 的上下文中,路徑編輯器通常指的是一個圖形使用者介面 (GUI) 應用程式,它有助於編輯使用 Matplotlib 的 Path 類定義的路徑。
在深入研究路徑編輯器之前,瞭解 Matplotlib 路徑的基礎知識至關重要。路徑是 Matplotlib 中的一個基本物件,它包含各種元素,例如線段、曲線和matplotlib.patches 模組中的形狀。路徑透過指定一系列命令(例如 moveto、lineto 和 curveto)來定義複雜的輪廓,提供了一種通用的方法。
Matplotlib 提供了一個強大的Path 類,作為建立和操作視覺化中路徑的基礎。
分步實施
在本教程中,我們將探索 Matplotlib 路徑編輯器,這是一個跨 GUI 應用程式,它使用 Matplotlib 的事件處理功能來互動式地編輯和修改畫布上的路徑。
建立 PathInteractor 類
建立一個路徑編輯器 (PathInteractor) 類來處理與已定義路徑的互動。此類包括用於切換頂點標記(使用“t”鍵)、拖動頂點以及響應滑鼠和鍵盤事件的方法。
示例
import matplotlib.pyplot as plt
import numpy as np

from matplotlib.backend_bases import MouseButton
from matplotlib.patches import PathPatch
from matplotlib.path import Path

class PathInteractor:

   showverts = True
   # max pixel distance to count as a vertex hit
   epsilon = 5

   def __init__(self, pathpatch):
      # Initialization and event connections
      self.ax = pathpatch.axes
      canvas = self.ax.figure.canvas
      self.pathpatch = pathpatch
      self.pathpatch.set_animated(True)

      x, y = zip(*self.pathpatch.get_path().vertices)

      self.line, = ax.plot(
         x, y, marker='o', markerfacecolor='r', animated=True)

      self._ind = None  # the active vertex

      canvas.mpl_connect('draw_event', self.on_draw)
      canvas.mpl_connect('button_press_event', self.on_button_press)
      canvas.mpl_connect('key_press_event', self.on_key_press)
      canvas.mpl_connect('button_release_event', self.on_button_release)
      canvas.mpl_connect('motion_notify_event', self.on_mouse_move)
      self.canvas = canvas

   def get_ind_under_point(self, event):
      # Return the index of the point closest to the event position or *None*
      xy = self.pathpatch.get_path().vertices
      xyt = self.pathpatch.get_transform().transform(xy)  # to display coords
      xt, yt = xyt[:, 0], xyt[:, 1]
      d = np.sqrt((xt - event.x)**2 + (yt - event.y)**2)
      ind = d.argmin()
      return ind if d[ind] < self.epsilon else None

   def on_draw(self, event):
      # Callback for draws.
      self.background = self.canvas.copy_from_bbox(self.ax.bbox)
      self.ax.draw_artist(self.pathpatch)
      self.ax.draw_artist(self.line)
      self.canvas.blit(self.ax.bbox)

   def on_button_press(self, event):
      # Callback for mouse button presses
      if (event.inaxes is None
            or event.button != MouseButton.LEFT
            or not self.showverts):
         return
     self._ind = self.get_ind_under_point(event)

   def on_button_release(self, event):
      # Callback for mouse button releases
      if (event.button != MouseButton.LEFT
            or not self.showverts):
         return
      self._ind = None

   def on_key_press(self, event):
      # Callback for key presses
      if not event.inaxes:
         return
      if event.key == 't':
         self.showverts = not self.showverts
         self.line.set_visible(self.showverts)
         if not self.showverts:
            self._ind = None
      self.canvas.draw()

   def on_mouse_move(self, event):
      # Callback for mouse movements
      if (self._ind is None
         or event.inaxes is None
         or event.button != MouseButton.LEFT
         or not self.showverts):
      return

      vertices = self.pathpatch.get_path().vertices

      vertices[self._ind] = event.xdata, event.ydata
      self.line.set_data(zip(*vertices))

      self.canvas.restore_region(self.background)
      self.ax.draw_artist(self.pathpatch)
      self.ax.draw_artist(self.line)
      self.canvas.blit(self.ax.bbox)
事件處理和畫布互動
PathInteractor 類將各種回撥連線到畫布事件,使使用者能夠與已定義的路徑進行互動。這些互動包括按下和釋放滑鼠按鈕、拖動頂點以及使用按鍵切換頂點標記。
canvas.mpl_connect('draw_event', self.on_draw)
canvas.mpl_connect('button_press_event', self.on_button_press)
canvas.mpl_connect('key_press_event', self.on_key_press)
canvas.mpl_connect('button_release_event', self.on_button_release)
canvas.mpl_connect('motion_notify_event', self.on_mouse_move)
定義和視覺化路徑
首先定義一個預定義的路徑,該路徑由各種路徑程式碼和頂點組成,這些程式碼和頂點是使用 Matplotlib Path 類建立的。然後,使用 PathPatch 例項在畫布上視覺化此路徑,從而為繪圖新增互動元件。
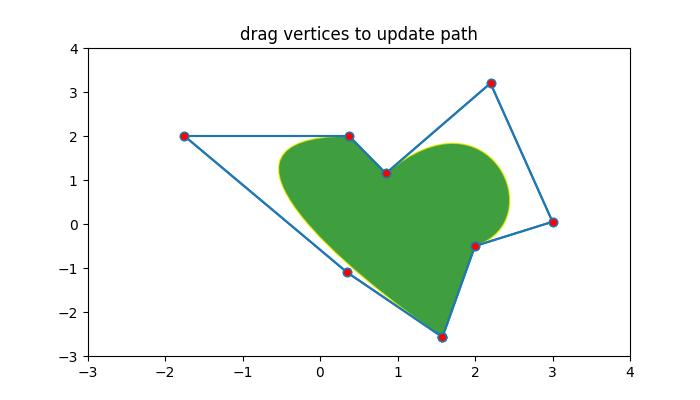
fig, ax = plt.subplots()

pathdata = [
   (Path.MOVETO, (1.58, -2.57)),
   (Path.CURVE4, (0.35, -1.1)),
   (Path.CURVE4, (-1.75, 2.0)),
   (Path.CURVE4, (0.375, 2.0)),
   (Path.LINETO, (0.85, 1.15)),
   (Path.CURVE4, (2.2, 3.2)),
   (Path.CURVE4, (3, 0.05)),
   (Path.CURVE4, (2.0, -0.5)),
   (Path.CLOSEPOLY, (1.58, -2.57)),
]

codes, verts = zip(*pathdata)
path = Path(verts, codes)
patch = PathPatch(
   path, facecolor='green', edgecolor='yellow', alpha=0.5)
ax.add_patch(patch)
執行路徑編輯器
例項化 PathInteractor 類,設定繪圖屬性並顯示繪圖。使用者現在可以互動式地拖動頂點,使用“t”鍵切換頂點標記,並觀察即時更新。
interactor = PathInteractor(patch)
ax.set_title('drag vertices to update path')
ax.set_xlim(-3, 4)
ax.set_ylim(-3, 4)

plt.show()
示例
讓我們看看 Matplotlib 路徑編輯器的完整示例。
import matplotlib.pyplot as plt
import numpy as np

from matplotlib.backend_bases import MouseButton
from matplotlib.patches import PathPatch
from matplotlib.path import Path


class PathInteractor:

   showverts = True
   # max pixel distance to count as a vertex hit
   epsilon = 5

   def __init__(self, pathpatch):
      # Initialization and event connections
      self.ax = pathpatch.axes
      canvas = self.ax.figure.canvas
      self.pathpatch = pathpatch
      self.pathpatch.set_animated(True)

      x, y = zip(*self.pathpatch.get_path().vertices)

      self.line, = ax.plot(
         x, y, marker='o', markerfacecolor='r', animated=True)

      self._ind = None  # the active vertex

      canvas.mpl_connect('draw_event', self.on_draw)
      canvas.mpl_connect('button_press_event', self.on_button_press)
      canvas.mpl_connect('key_press_event', self.on_key_press)
      canvas.mpl_connect('button_release_event', self.on_button_release)
      canvas.mpl_connect('motion_notify_event', self.on_mouse_move)
      self.canvas = canvas

   def get_ind_under_point(self, event):
      # Return the index of the point closest to the event position or *None*
      xy = self.pathpatch.get_path().vertices
      xyt = self.pathpatch.get_transform().transform(xy)  # to display coords
      xt, yt = xyt[:, 0], xyt[:, 1]
      d = np.sqrt((xt - event.x)**2 + (yt - event.y)**2)
      ind = d.argmin()
         return ind if d[ind] < self.epsilon else None

   def on_draw(self, event):
      # Callback for draws.
      self.background = self.canvas.copy_from_bbox(self.ax.bbox)
      self.ax.draw_artist(self.pathpatch)
      self.ax.draw_artist(self.line)
      self.canvas.blit(self.ax.bbox)

   def on_button_press(self, event):
      # Callback for mouse button presses
      if (event.inaxes is None
         or event.button != MouseButton.LEFT
         or not self.showverts):
         return
      self._ind = self.get_ind_under_point(event)

   def on_button_release(self, event):
      # Callback for mouse button releases
      if (event.button != MouseButton.LEFT
         or not self.showverts):
         return
      self._ind = None

   def on_key_press(self, event):
      # Callback for key presses
      if not event.inaxes:
         return
      if event.key == 't':
         self.showverts = not self.showverts
         self.line.set_visible(self.showverts)
         if not self.showverts:
            self._ind = None
      self.canvas.draw()

   def on_mouse_move(self, event):
      # Callback for mouse movements
      if (self._ind is None
         or event.inaxes is None
         or event.button != MouseButton.LEFT
         or not self.showverts):
      return

      vertices = self.pathpatch.get_path().vertices

      vertices[self._ind] = event.xdata, event.ydata
      self.line.set_data(zip(*vertices))

      self.canvas.restore_region(self.background)
      self.ax.draw_artist(self.pathpatch)
      self.ax.draw_artist(self.line)
      self.canvas.blit(self.ax.bbox)

fig, ax = plt.subplots()

pathdata = [
   (Path.MOVETO, (1.58, -2.57)),
   (Path.CURVE4, (0.35, -1.1)),
   (Path.CURVE4, (-1.75, 2.0)),
   (Path.CURVE4, (0.375, 2.0)),
   (Path.LINETO, (0.85, 1.15)),
   (Path.CURVE4, (2.2, 3.2)),
   (Path.CURVE4, (3, 0.05)),
   (Path.CURVE4, (2.0, -0.5)),
   (Path.CLOSEPOLY, (1.58, -2.57)),
]

codes, verts = zip(*pathdata)
path = Path(verts, codes)
patch = PathPatch(
   path, facecolor='green', edgecolor='yellow', alpha=0.5)
ax.add_patch(patch)

interactor = PathInteractor(patch)
ax.set_title('drag vertices to update path')
ax.set_xlim(-3, 4)
ax.set_ylim(-3, 4)

plt.show()
輸出
執行上述程式後,您將獲得以下圖形。按鍵盤上的“t”鍵。此操作會切換頂點標記的可見性。當頂點標記可見(按下“t”後)時,您可以使用滑鼠拖動這些標記。觀察拖動頂點如何影響路徑的形狀。
觀看下面的影片,瞭解路徑編輯器的工作原理。
