- Matplotlib 基礎
- Matplotlib - 首頁
- Matplotlib - 簡介
- Matplotlib - 與 Seaborn 的對比
- Matplotlib - 環境搭建
- Matplotlib - Anaconda 發行版
- Matplotlib - Jupyter Notebook
- Matplotlib - Pyplot API
- Matplotlib - 簡單繪圖
- Matplotlib - 儲存圖形
- Matplotlib - 標記
- Matplotlib - 圖形
- Matplotlib - 樣式
- Matplotlib - 圖例
- Matplotlib - 顏色
- Matplotlib - 顏色對映
- Matplotlib - 顏色對映歸一化
- Matplotlib - 選擇顏色對映
- Matplotlib - 色標
- Matplotlib - 文字
- Matplotlib - 文字屬性
- Matplotlib - 子圖示題
- Matplotlib - 影像
- Matplotlib - 影像蒙版
- Matplotlib - 註釋
- Matplotlib - 箭頭
- Matplotlib - 字型
- Matplotlib - 什麼是字型?
- 全域性設定字型屬性
- Matplotlib - 字型索引
- Matplotlib - 字型屬性
- Matplotlib - 刻度
- Matplotlib - 線性與對數刻度
- Matplotlib - 對稱對數與Logit刻度
- Matplotlib - LaTeX
- Matplotlib - 什麼是LaTeX?
- Matplotlib - LaTeX用於數學表示式
- Matplotlib - LaTeX在註釋中的文字格式化
- Matplotlib - PostScript
- 在註釋中啟用LaTeX渲染
- Matplotlib - 數學表示式
- Matplotlib - 動畫
- Matplotlib - 圖形物件
- Matplotlib - 使用Cycler進行樣式設定
- Matplotlib - 路徑
- Matplotlib - 路徑效果
- Matplotlib - 轉換
- Matplotlib - 刻度和刻度標籤
- Matplotlib - 弧度刻度
- Matplotlib - 日期刻度
- Matplotlib - 刻度格式化器
- Matplotlib - 刻度定位器
- Matplotlib - 基本單位
- Matplotlib - 自動縮放
- Matplotlib - 反轉軸
- Matplotlib - 對數軸
- Matplotlib - Symlog
- Matplotlib - 單位處理
- Matplotlib - 帶單位的橢圓
- Matplotlib - 脊柱
- Matplotlib - 軸範圍
- Matplotlib - 軸刻度
- Matplotlib - 軸刻度
- Matplotlib - 格式化軸
- Matplotlib - Axes 類
- Matplotlib - 雙軸
- Matplotlib - Figure 類
- Matplotlib - 多圖繪製
- Matplotlib - 網格
- Matplotlib - 面向物件介面
- Matplotlib - PyLab 模組
- Matplotlib - Subplots() 函式
- Matplotlib - Subplot2grid() 函式
- Matplotlib - 固定圖形物件
- Matplotlib - 手動等值線
- Matplotlib - 座標報告
- Matplotlib - AGG 過濾器
- Matplotlib - 緞帶框
- Matplotlib - 填充螺旋線
- Matplotlib - Findobj 演示
- Matplotlib - 超連結
- Matplotlib - 影像縮圖
- Matplotlib - 使用關鍵字繪圖
- Matplotlib - 建立徽標
- Matplotlib - 多頁 PDF
- Matplotlib - 多程序
- Matplotlib - 列印標準輸出
- Matplotlib - 複合路徑
- Matplotlib - Sankey 類
- Matplotlib - MRI 與 EEG
- Matplotlib - 樣式表
- Matplotlib - 背景顏色
- Matplotlib - Basemap
- Matplotlib 事件處理
- Matplotlib - 事件處理
- Matplotlib - 關閉事件
- Matplotlib - 滑鼠移動
- Matplotlib - 點選事件
- Matplotlib - 滾動事件
- Matplotlib - 按鍵事件
- Matplotlib - 選擇事件
- Matplotlib - 透鏡
- Matplotlib - 路徑編輯器
- Matplotlib - 多邊形編輯器
- Matplotlib - 定時器
- Matplotlib - Viewlims
- Matplotlib - 縮放視窗
- Matplotlib 小部件
- Matplotlib - 遊標小部件
- Matplotlib - 帶註釋的遊標
- Matplotlib - 按鈕小部件
- Matplotlib - 複選框
- Matplotlib - 套索選擇器
- Matplotlib - 選單小部件
- Matplotlib - 滑鼠游標
- Matplotlib - 多遊標
- Matplotlib - 多邊形選擇器
- Matplotlib - 單選按鈕
- Matplotlib - 範圍滑塊
- Matplotlib - 矩形選擇器
- Matplotlib - 橢圓選擇器
- Matplotlib - 滑塊小部件
- Matplotlib - 跨度選擇器
- Matplotlib - 文字框
- Matplotlib 繪圖
- Matplotlib - 條形圖
- Matplotlib - 直方圖
- Matplotlib - 餅圖
- Matplotlib - 散點圖
- Matplotlib - 箱線圖
- Matplotlib - 小提琴圖
- Matplotlib - 等值線圖
- Matplotlib - 3D 繪圖
- Matplotlib - 3D 等值線
- Matplotlib - 3D 線框圖
- Matplotlib - 3D 曲面圖
- Matplotlib - Quiver 圖
- Matplotlib 有用資源
- Matplotlib - 快速指南
- Matplotlib - 有用資源
- Matplotlib - 討論
Matplotlib - 多圖繪製
在本章中,我們將學習如何在同一畫布上建立多個子圖。
subplot() 函式在給定的網格位置返回軸物件。此函式的呼叫簽名為:
plt.subplot(subplot(nrows, ncols, index)
在當前圖形中,該函式在 nrows 行 ncols 列軸的網格的指定位置索引處建立並返回一個 Axes 物件。索引從 1 到 nrows * ncols,以行主序遞增。如果 nrows、ncols 和 index 都小於 10。索引也可以作為單個、連線的、三位數字給出。
例如,subplot(2, 3, 3) 和 subplot(233) 都在當前圖形的右上角建立一個 Axes,佔據圖形高度的一半和圖形寬度的三分之一。
建立子圖將刪除任何與其重疊的先前存在的子圖,超出共享邊界。
import matplotlib.pyplot as plt
# plot a line, implicitly creating a subplot(111)
plt.plot([1,2,3])
# now create a subplot which represents the top plot of a grid with 2 rows and 1 column.
#Since this subplot will overlap the first, the plot (and its axes) previously
created, will be removed
plt.subplot(211)
plt.plot(range(12))
plt.subplot(212, facecolor='y') # creates 2nd subplot with yellow background
plt.plot(range(12))
以上程式碼行生成以下輸出:
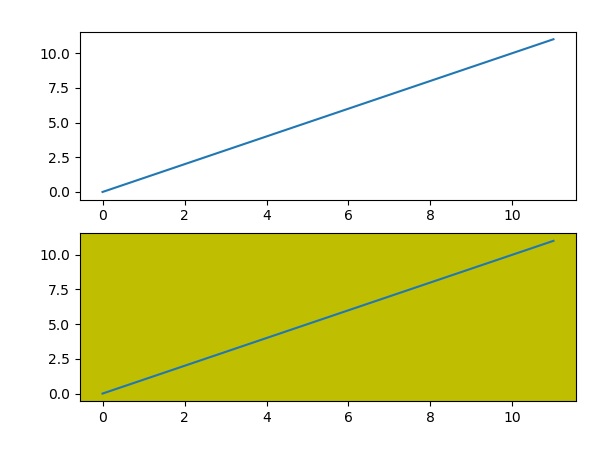
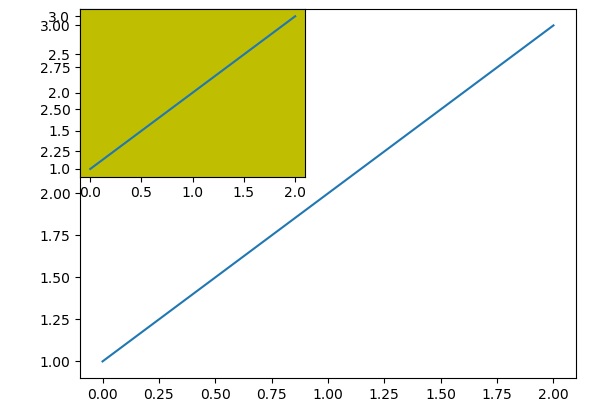
figure 類的 add_subplot() 函式不會覆蓋現有的繪圖:
import matplotlib.pyplot as plt
fig = plt.figure()
ax1 = fig.add_subplot(111)
ax1.plot([1,2,3])
ax2 = fig.add_subplot(221, facecolor='y')
ax2.plot([1,2,3])
當執行以上程式碼行時,它會生成以下輸出:
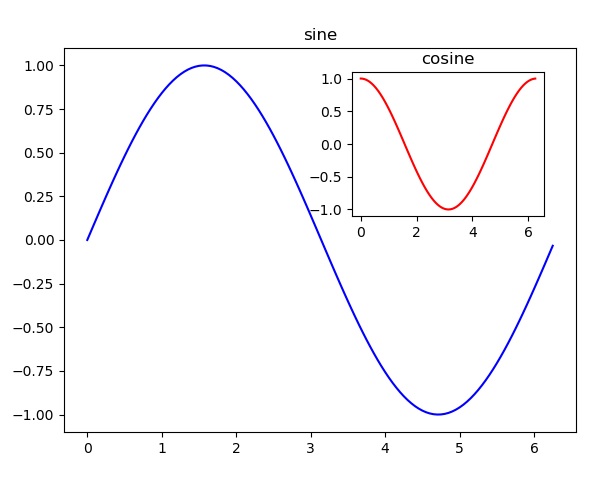
您可以在同一圖形中新增插入繪圖,方法是在同一圖形畫布中新增另一個軸物件。
import matplotlib.pyplot as plt
import numpy as np
import math
x = np.arange(0, math.pi*2, 0.05)
fig=plt.figure()
axes1 = fig.add_axes([0.1, 0.1, 0.8, 0.8]) # main axes
axes2 = fig.add_axes([0.55, 0.55, 0.3, 0.3]) # inset axes
y = np.sin(x)
axes1.plot(x, y, 'b')
axes2.plot(x,np.cos(x),'r')
axes1.set_title('sine')
axes2.set_title("cosine")
plt.show()
執行以上程式碼行後,將生成以下輸出:
廣告