- Matplotlib 基礎
- Matplotlib - 首頁
- Matplotlib - 簡介
- Matplotlib - 與 Seaborn 的比較
- Matplotlib - 環境設定
- Matplotlib - Anaconda 發行版
- Matplotlib - Jupyter Notebook
- Matplotlib - Pyplot API
- Matplotlib - 簡單繪圖
- Matplotlib - 儲存圖片
- Matplotlib - 標記
- Matplotlib - 圖形
- Matplotlib - 風格
- Matplotlib - 圖例
- Matplotlib - 顏色
- Matplotlib - 顏色圖
- Matplotlib - 顏色圖歸一化
- Matplotlib - 選擇顏色圖
- Matplotlib - 顏色條
- Matplotlib - 文字
- Matplotlib - 文字屬性
- Matplotlib - 子圖示題
- Matplotlib - 圖片
- Matplotlib - 圖片蒙版
- Matplotlib - 註釋
- Matplotlib - 箭頭
- Matplotlib - 字型
- Matplotlib - 什麼是字型?
- 全域性設定字型屬性
- Matplotlib - 字型索引
- Matplotlib - 字型屬性
- Matplotlib - 比例尺
- Matplotlib - 線性與對數比例尺
- Matplotlib - 對稱對數與Logit比例尺
- Matplotlib - LaTeX
- Matplotlib - 什麼是LaTeX?
- Matplotlib - 用於數學表示式的LaTeX
- Matplotlib - 註釋中的LaTeX文字格式
- Matplotlib - PostScript
- 啟用註釋中的LaTex渲染
- Matplotlib - 數學表示式
- Matplotlib - 動畫
- Matplotlib - 圖形元素
- Matplotlib - 使用Cycler進行樣式設定
- Matplotlib - 路徑
- Matplotlib - 路徑效果
- Matplotlib - 變換
- Matplotlib - 刻度和刻度標籤
- Matplotlib - 弧度刻度
- Matplotlib - 日期刻度
- Matplotlib - 刻度格式化器
- Matplotlib - 刻度定位器
- Matplotlib - 基本單位
- Matplotlib - 自動縮放
- Matplotlib - 反轉座標軸
- Matplotlib - 對數座標軸
- Matplotlib - Symlog
- Matplotlib - 單位處理
- Matplotlib - 帶單位的橢圓
- Matplotlib - 脊柱
- Matplotlib - 座標軸範圍
- Matplotlib - 座標軸比例尺
- Matplotlib - 座標軸刻度
- Matplotlib - 格式化座標軸
- Matplotlib - Axes 類
- Matplotlib - 雙座標軸
- Matplotlib - Figure 類
- Matplotlib - 多圖
- Matplotlib - 網格
- Matplotlib - 面向物件介面
- Matplotlib - PyLab 模組
- Matplotlib - Subplots() 函式
- Matplotlib - Subplot2grid() 函式
- Matplotlib - 錨定圖形元素
- Matplotlib - 手動等高線
- Matplotlib - 座標報告
- Matplotlib - AGG 過濾器
- Matplotlib - 帶狀盒圖
- Matplotlib - 填充螺旋線
- Matplotlib - Findobj 演示
- Matplotlib - 超連結
- Matplotlib - 圖片縮圖
- Matplotlib - 使用關鍵字繪圖
- Matplotlib - 建立Logo
- Matplotlib - 多頁PDF
- Matplotlib - 多程序
- Matplotlib - 列印標準輸出
- Matplotlib - 複合路徑
- Matplotlib - Sankey 類
- Matplotlib - MRI 與 EEG
- Matplotlib - 樣式表
- Matplotlib - 背景顏色
- Matplotlib - Basemap
- Matplotlib 事件處理
- Matplotlib - 事件處理
- Matplotlib - 關閉事件
- Matplotlib - 滑鼠移動
- Matplotlib - 點選事件
- Matplotlib - 滾動事件
- Matplotlib - 按鍵事件
- Matplotlib - 選擇事件
- Matplotlib - 透鏡
- Matplotlib - 路徑編輯器
- Matplotlib - 多邊形編輯器
- Matplotlib - 定時器
- Matplotlib - Viewlims
- Matplotlib - 縮放視窗
- Matplotlib 小部件
- Matplotlib - 游標小部件
- Matplotlib - 帶註釋的游標
- Matplotlib - 按鈕小部件
- Matplotlib - 複選框
- Matplotlib - 套索選擇器
- Matplotlib - 選單小部件
- Matplotlib - 滑鼠游標
- Matplotlib - 多游標
- Matplotlib - 多邊形選擇器
- Matplotlib - 單選按鈕
- Matplotlib - 範圍滑塊
- Matplotlib - 矩形選擇器
- Matplotlib - 橢圓選擇器
- Matplotlib - 滑塊小部件
- Matplotlib - 跨度選擇器
- Matplotlib - 文字框
- Matplotlib 繪圖
- Matplotlib - 條形圖
- Matplotlib - 直方圖
- Matplotlib - 餅圖
- Matplotlib - 散點圖
- Matplotlib - 箱線圖
- Matplotlib - 小提琴圖
- Matplotlib - 等高線圖
- Matplotlib - 3D 繪圖
- Matplotlib - 3D 等高線
- Matplotlib - 3D 線框圖
- Matplotlib - 3D 曲面圖
- Matplotlib - 矢羽圖
- Matplotlib 有用資源
- Matplotlib - 快速指南
- Matplotlib - 有用資源
- Matplotlib - 討論
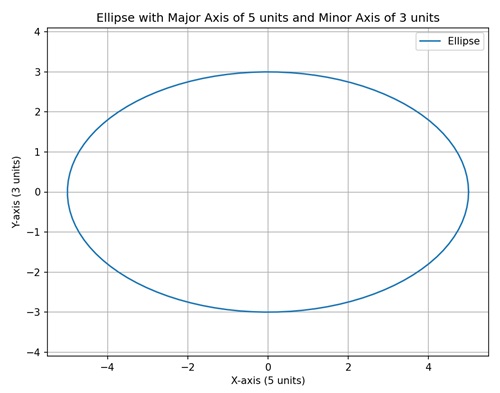
Matplotlib - 帶單位的橢圓
橢圓是一種幾何形狀,看起來像一個拉長的圓形。它由兩個關鍵屬性定義:長軸(最長直徑)和短軸(最短直徑)。這些軸在橢圓的中心相交,橢圓的形狀由這些軸的長度決定。長軸中心到邊緣的距離和短軸中心到邊緣的距離都很重要。
從單位的角度來看,你會使用某種單位來測量這些距離,例如英寸、釐米或你選擇的任何其他測量單位。因此,當我們說帶單位的橢圓時,我們的意思是我們使用具體的測量值(單位)來描述橢圓的大小,同時考慮長軸和短軸的長度。
Matplotlib 中帶單位的橢圓
我們可以使用 "matplotlib.patches" 模組中的 "Ellipse" 類在 Matplotlib 中建立帶單位的橢圓。"Ellipse" 類允許你定義橢圓的中心、寬度和高度(長軸和短軸)、旋轉角度以及其他屬性,例如其旋轉角度。
軸的測量單位取決於你使用的座標系。例如,如果你使用英寸單位的繪圖,則長軸和短軸的長度將以英寸為單位。
資料座標系中固定大小的橢圓
在 Matplotlib 中,在資料座標系中建立固定大小的橢圓涉及在繪圖上繪製一個特定大小和位置由資料座標確定的橢圓。這意味著橢圓的尺寸以與你的實際資料相同的單位指定。
例如,如果你有一個包含 x 和 y 值的資料集,你可以繪製一個橢圓,其中心位於特定的 (x, y) 點,並且橢圓的寬度和高度以資料座標定義。
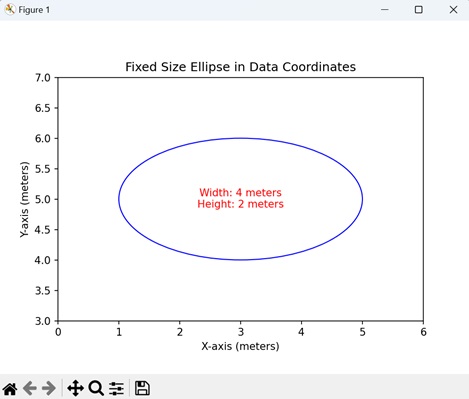
示例
我們正在繪製一個簡單的橢圓,其固定大小以資料座標指定。橢圓的中心位於繪圖上的 (3, 5) 位置,寬度設定為米為單位的“4”個單位,高度設定為“2”個單位。
import matplotlib.pyplot as plt
from matplotlib.patches import Ellipse

# Creating a plot
fig, ax = plt.subplots()

# Ellipse in data coordinates (units: meters)
ellipse = Ellipse((3, 5), width=4, height=2, edgecolor='b', facecolor='none')
ax.add_patch(ellipse)

# Setting plot title and labels
ax.set_title('Fixed Size Ellipse in Data Coordinates')
ax.set_xlabel('X-axis (meters)')
ax.set_ylabel('Y-axis (meters)')

# Setting aspect ratio to 'equal'
ax.set_aspect('equal')

# Adjusting axis limits
ax.set_xlim(0, 6)
ax.set_ylim(3, 7)

# Displaying dimensions
plt.text(3, 5, f'Width: 4 meters\nHeight: 2 meters', ha='center', va='center', color='red', fontsize=10)
plt.show()
輸出
以下是上述程式碼的輸出:
座標軸座標系中可變大小的橢圓
在 Matplotlib 中建立在座標軸座標系中具有可變大小的橢圓涉及繪製一個繪圖上的橢圓,其中尺寸以座標軸而不是實際資料來指定。換句話說,橢圓的寬度和高度分別作為 x 軸和 y 軸總長度的百分比給出。
例如,如果你想視覺化一個始終覆蓋 x 軸的 60% 和 y 軸的 30% 的橢圓,而不管具體資料值如何,你可以使用座標軸座標。當你想讓橢圓的大小相對於繪圖的整體尺寸時,這尤其有用。
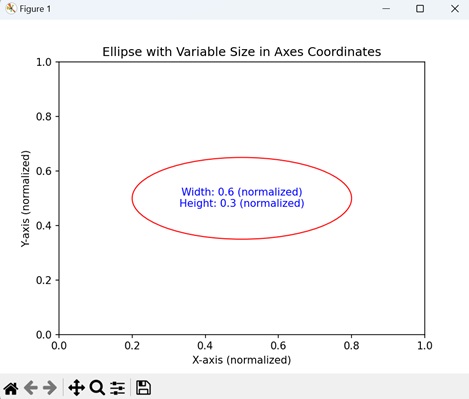
示例
在這裡,我們正在繪製一個以座標軸座標指定可變大小的橢圓。橢圓的中心位於 (0.5, 0.5),對應於繪圖的中心。寬度和高度分別設定為相應軸長度的 60% 和 30%,允許橢圓隨著座標軸的變化而縮放。
import matplotlib.pyplot as plt
from matplotlib.patches import Ellipse

# Creating a plot
fig, ax = plt.subplots()

# Ellipse in axes coordinates
ellipse = Ellipse((0.5, 0.5), width=0.6, height=0.3, edgecolor='r', facecolor='none', transform=ax.transAxes)
ax.add_patch(ellipse)

# Setting plot title and labels
ax.set_title('Ellipse with Variable Size in Axes Coordinates')
ax.set_xlabel('X-axis (normalized)')
ax.set_ylabel('Y-axis (normalized)')

# Displaying dimensions in the output
plt.text(0.5, 0.5, f'Width: 0.6 (normalized)\nHeight: 0.3 (normalized)', ha='center', va='center', color='blue', fontsize=10, transform=ax.transAxes)
plt.show()
輸出
執行上述程式碼後,我們將獲得以下輸出:
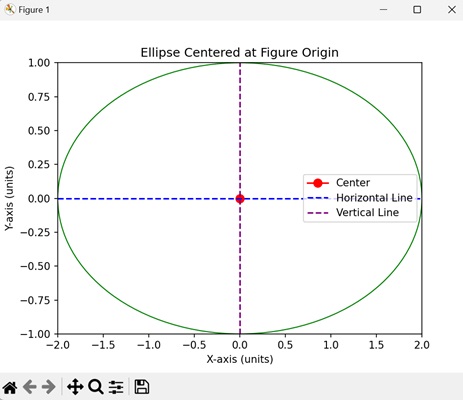
以圖形原點為中心的橢圓
在 Matplotlib 中建立以圖形原點為中心的橢圓涉及在繪圖上繪製一個橢圓,其中心位於整個圖形的原點。原點是圖形座標系中的 (0, 0) 點。在這種情況下,橢圓的寬度和高度以圖形的單位指定,橢圓的中心正好位於原點。
這演示瞭如何相對於整個圖形而不是單個座標軸來定位橢圓。
示例
在下面的示例中,我們正在建立一個以圖形原點 (0, 0) 為中心的橢圓。寬度設定為 4 個單位,高度設定為 2 個單位。
import matplotlib.pyplot as plt
from matplotlib.patches import Ellipse
import numpy as np

# Creating a plot
fig, ax = plt.subplots()

# Ellipse centered at figure origin
ellipse = Ellipse((0, 0), width=4, height=2, edgecolor='g', facecolor='none', transform=ax.transData)
ax.add_patch(ellipse)

# Marking the center with a marker
center_x, center_y = 0, 0
ax.plot(center_x, center_y, marker='o', markersize=8, color='red', label='Center')

# Dotted line to represent the center
ax.plot([center_x, center_x], [center_y, center_y], 'r--')

# Horizontal and vertical lines passing through the center
ax.axhline(center_y, color='blue', linestyle='--', label='Horizontal Line')
ax.axvline(center_x, color='purple', linestyle='--', label='Vertical Line')

# Setting plot title and labels
ax.set_title('Ellipse Centered at Figure Origin')
ax.set_xlabel('X-axis (units)')
ax.set_ylabel('Y-axis (units)')

# Adjusting axis limits to make the ellipse and lines visible
ax.set_xlim(-2, 2)
ax.set_ylim(-1, 1)

# Adding legend
ax.legend()
plt.show()
輸出
執行上述程式碼後,我們將獲得以下輸出:
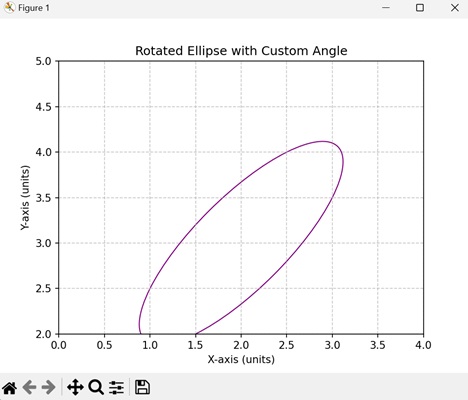
帶自定義角度的旋轉橢圓
在 Matplotlib 中建立帶自定義角度的旋轉橢圓涉及在繪圖上繪製一個橢圓並指定一個自定義角度來旋轉它。旋轉角度決定了橢圓在繪圖中的傾斜或旋轉方式。當你想突出顯示特定方向的特徵時,這很有用。
示例
現在,我們正在建立一個旋轉角度為“45”度的旋轉橢圓,從而得到一個傾斜的橢圓。橢圓的中心位於 (2, 3),寬度和高度以資料座標指定。
import matplotlib.pyplot as plt
from matplotlib.patches import Ellipse

# Creating a plot
fig, ax = plt.subplots()

# Rotated ellipse with custom angle
ellipse = Ellipse((2, 3), width=3, height=1, angle=45, edgecolor='purple', facecolor='none', transform=ax.transData)
ax.add_patch(ellipse)

# Setting plot title and labels
ax.set_title('Rotated Ellipse with Custom Angle')
ax.set_xlabel('X-axis (units)')
ax.set_ylabel('Y-axis (units)')

# Setting aspect ratio to 'equal'
ax.set_aspect('equal')

# Adjusting axis limits
ax.set_xlim(0, 4)
ax.set_ylim(2, 5)

# Adding grid for better visualization
ax.grid(True, linestyle='--', alpha=0.7)
plt.show()
輸出
執行上述程式碼後,我們將獲得以下輸出: