- Matplotlib 基礎
- Matplotlib - 首頁
- Matplotlib - 簡介
- Matplotlib - 與Seaborn對比
- Matplotlib - 環境搭建
- Matplotlib - Anaconda發行版
- Matplotlib - Jupyter Notebook
- Matplotlib - Pyplot API
- Matplotlib - 簡單繪圖
- Matplotlib - 儲存圖片
- Matplotlib - 標記
- Matplotlib - 圖表
- Matplotlib - 樣式
- Matplotlib - 圖例
- Matplotlib - 顏色
- Matplotlib - 顏色對映
- Matplotlib - 顏色對映規範化
- Matplotlib - 選擇顏色對映
- Matplotlib - 顏色條
- Matplotlib - 文字
- Matplotlib - 文字屬性
- Matplotlib - 子圖示題
- Matplotlib - 圖片
- Matplotlib - 圖片蒙版
- Matplotlib - 註釋
- Matplotlib - 箭頭
- Matplotlib - 字型
- Matplotlib - 什麼是字型?
- 全域性設定字型屬性
- Matplotlib - 字型索引
- Matplotlib - 字型屬性
- Matplotlib - 刻度
- Matplotlib - 線性與對數刻度
- Matplotlib - 對稱對數和Logit刻度
- Matplotlib - LaTeX
- Matplotlib - 什麼是LaTeX?
- Matplotlib - LaTeX用於數學表示式
- Matplotlib - 在註釋中使用LaTeX文字格式
- Matplotlib - PostScript
- 啟用註釋中的LaTeX渲染
- Matplotlib - 數學表示式
- Matplotlib - 動畫
- Matplotlib - 圖形物件
- Matplotlib - 使用Cycler進行樣式設定
- Matplotlib - 路徑
- Matplotlib - 路徑效果
- Matplotlib - 變換
- Matplotlib - 刻度和刻度標籤
- Matplotlib - 弧度刻度
- Matplotlib - 日期刻度
- Matplotlib - 刻度格式化器
- Matplotlib - 刻度定位器
- Matplotlib - 基本單位
- Matplotlib - 自動縮放
- Matplotlib - 反轉座標軸
- Matplotlib - 對數座標軸
- Matplotlib - Symlog
- Matplotlib - 單位處理
- Matplotlib - 帶單位的橢圓
- Matplotlib - 脊柱
- Matplotlib - 座標軸範圍
- Matplotlib - 座標軸刻度
- Matplotlib - 座標軸刻度
- Matplotlib - 格式化座標軸
- Matplotlib - Axes類
- Matplotlib - 雙座標軸
- Matplotlib - Figure類
- Matplotlib - 多圖
- Matplotlib - 網格
- Matplotlib - 面向物件介面
- Matplotlib - PyLab模組
- Matplotlib - subplots()函式
- Matplotlib - subplot2grid()函式
- Matplotlib - 固定位置的圖形物件
- Matplotlib - 手動等高線
- Matplotlib - 座標報告
- Matplotlib - AGG濾鏡
- Matplotlib - 飄帶框
- Matplotlib - 填充螺旋線
- Matplotlib - findobj演示
- Matplotlib - 超連結
- Matplotlib - 圖片縮圖
- Matplotlib - 使用關鍵字繪圖
- Matplotlib - 建立Logo
- Matplotlib - 多頁PDF
- Matplotlib - 多程序
- Matplotlib - 列印標準輸出
- Matplotlib - 複合路徑
- Matplotlib - Sankey類
- Matplotlib - MRI與EEG
- Matplotlib - 樣式表
- Matplotlib - 背景顏色
- Matplotlib - Basemap
- Matplotlib 事件處理
- Matplotlib - 事件處理
- Matplotlib - 關閉事件
- Matplotlib - 滑鼠移動
- Matplotlib - 點選事件
- Matplotlib - 滾動事件
- Matplotlib - 按鍵事件
- Matplotlib - 選擇事件
- Matplotlib - 透視鏡
- Matplotlib - 路徑編輯器
- Matplotlib - 多邊形編輯器
- Matplotlib - 定時器
- Matplotlib - viewlims
- Matplotlib - 縮放視窗
- Matplotlib 控制元件
- Matplotlib - 遊標控制元件
- Matplotlib - 帶註釋的遊標
- Matplotlib - 按鈕控制元件
- Matplotlib - 複選框
- Matplotlib - 套索選擇器
- Matplotlib - 選單控制元件
- Matplotlib - 滑鼠遊標
- Matplotlib - 多遊標
- Matplotlib - 多邊形選擇器
- Matplotlib - 單選按鈕
- Matplotlib - RangeSlider
- Matplotlib - 矩形選擇器
- Matplotlib - 橢圓選擇器
- Matplotlib - 滑塊控制元件
- Matplotlib - 區間選擇器
- Matplotlib - 文字框
- Matplotlib 繪圖
- Matplotlib - 條形圖
- Matplotlib - 直方圖
- Matplotlib - 餅圖
- Matplotlib - 散點圖
- Matplotlib - 箱線圖
- Matplotlib - 小提琴圖
- Matplotlib - 等高線圖
- Matplotlib - 3D繪圖
- Matplotlib - 3D等高線
- Matplotlib - 3D線框圖
- Matplotlib - 3D曲面圖
- Matplotlib - 矢羽圖
- Matplotlib 有用資源
- Matplotlib - 快速指南
- Matplotlib - 有用資源
- Matplotlib - 討論
Matplotlib - PostScript
PostScript 是一種頁面描述語言和動態型別、基於堆疊的程式語言,通常縮寫為 PS。它由Adobe Systems公司在20世紀80年代初建立,其主要目的是描述列印頁面的佈局和圖形。它廣泛用於電子出版和桌面出版應用程式。
PostScript檔案可以在不同的裝置上列印或顯示而不會損失質量。這是生成用於不同目的的繪圖的關鍵優勢。
Matplotlib中的PostScript
在Matplotlib的上下文中,PostScript充當後端渲染引擎(用於在螢幕上顯示圖形或寫入檔案),使使用者能夠生成出版質量的繪圖和圖形。當您選擇PostScript後端時,Matplotlib會生成PostScript程式碼來描述繪圖的佈局和外觀。
Matplotlib生成的PostScript程式碼包括用於在頁面上繪製線條、形狀、文字和其他圖形元素的指令。這些指令是用PostScript程式語言編寫的。
Matplotlib PostScript後端(matplotlib.backends.backend_ps)可以生成.ps和.eps檔案。
建立PostScript檔案
讓我們探討如何使用Matplotlib建立一個簡單的繪圖並將其儲存為PostScript檔案。
示例1
此示例演示如何建立一個帶有換行文字的簡單繪圖並將其儲存為PostScript檔案(.ps)。
import matplotlib
import matplotlib.pyplot as plt

import textwrap
from pylab import *

# Generate a string containing printable characters (ASCII 32 to 126)
text_to_wrap = "".join(c for c in map(chr, range(32, 127)) if c.isprintable())

# Wrap the string to fit within the figure
wrapped_text = "\n".join(textwrap.wrap(text_to_wrap))

# Add the wrapped text to the figure
figtext(0, 0.5, wrapped_text)

# Save the figure to a PostScript file named "test.ps"
savefig("test.ps")
print('Successfully created the PostScript (PS) file...')
輸出
如果您訪問儲存輸出的資料夾,您可以看到名為test.ps的生成的PostScript檔案。
Successfully created the PostScript (PS) file...
示例2
這是一個示例,演示如何使用PostScript後端生成繪圖並將其儲存到封裝的PostScript (EPS) 檔案。
import numpy as np
from matplotlib import pyplot as plt

# Generate data
x_data = np.linspace(1, 10, 100)
y_data = np.sin(x_data)

# Create the plot
plt.plot(x_data, y_data, c='green', marker='o')
plt.grid()

# Save the figure to a PostScript file named "example.eps"
plt.savefig("example.eps")

print('Successfully created the encapsulated PostScript (EPS) file...')
輸出
如果您訪問儲存輸出的資料夾,您可以看到名為example.eps的生成的PostScript檔案。
Successfully created the encapsulated PostScript (EPS) file...
自定義PostScript輸出
調整Matplotlib中的PostScript輸出設定允許您增強封裝PostScript (EPS) 檔案的視覺質量。預設情況下,Matplotlib在建立EPS檔案時使用蒸餾過程。此蒸餾步驟會刪除LaTeX認為在EPS檔案中非法的特定PostScript運算子。
一種有效的解決方法包括修改解析度引數以獲得更好的視覺效果。rcParams["ps.distiller.res"]引數控制EPS檔案的解析度,預設值為6000。增加此值會導致檔案更大,但可能會顯著提高視覺質量並保持合理的縮放比例。
示例1
此示例演示如何調整解析度引數可以增強EPS檔案的視覺質量。
import numpy as np
import matplotlib.pyplot as plt

# Set the resolution for EPS files
plt.rcParams["ps.distiller.res"] = 12000

# Set the figure size and enable autolayout
plt.rcParams["figure.figsize"] = [7, 3.50]
plt.rcParams["figure.autolayout"] = True

# Generate data
x_data = np.linspace(1, 10, 100)
y_data = np.sin(x_data)

# Plotting
plt.plot(x_data, y_data, label='Sine Wave', color='green')

# Save the figure as an EPS file
plt.savefig('Output customized file.eps', format='eps', bbox_inches='tight')
print('Successfully created the output customized PostScript (EPS) file...')
輸出
如果您訪問儲存輸出的資料夾,您可以看到名為Output customized file.eps的生成的PostScript檔案。
Successfully created the output customized PostScript (EPS) file...
示例2
這是一個示例,演示了透過在savefig()函式中設定transparent=True引數如何在將繪圖儲存為.eps檔案時保留透明度。
import numpy as np
import matplotlib.pyplot as plt

# Adjust figure size and autolayout
plt.rcParams["figure.figsize"] = [7.50, 3.50]
plt.rcParams["figure.autolayout"] = True

# Generate data
x_data = np.linspace(1, 10, 100)
y_data = np.sin(x_data)

# Plot data with transparency
plt.plot(x_data, y_data, c='green', marker='o', alpha=.35, ms=10, lw=1)
plt.grid()

# Save plot as .eps by preserving the transparency
plt.savefig("lost_transparency_img.eps", transparent=True)

# Display plot
plt.show()
輸出
執行上述程式碼後,您將獲得以下輸出:
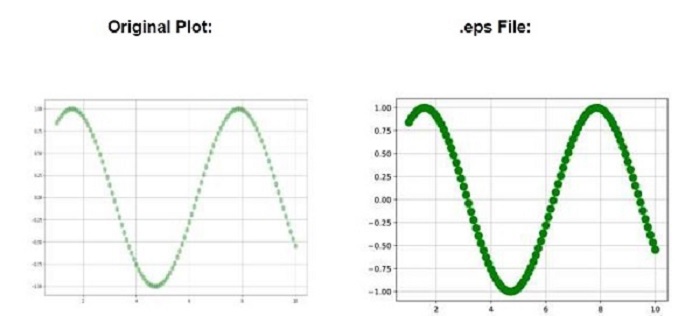
每當繪圖儲存為.eps/.ps時,繪圖的透明度就會丟失。您可以觀察以上圖片中的差異。