- Matplotlib 基礎
- Matplotlib - 首頁
- Matplotlib - 簡介
- Matplotlib - 與 Seaborn 的對比
- Matplotlib - 環境設定
- Matplotlib - Anaconda 發行版
- Matplotlib - Jupyter Notebook
- Matplotlib - Pyplot API
- Matplotlib - 簡單繪圖
- Matplotlib - 儲存圖形
- Matplotlib - 標記
- Matplotlib - 圖形
- Matplotlib - 樣式
- Matplotlib - 圖例
- Matplotlib - 顏色
- Matplotlib - 顏色對映
- Matplotlib - 顏色對映歸一化
- Matplotlib - 選擇顏色對映
- Matplotlib - 色標
- Matplotlib - 文字
- Matplotlib - 文字屬性
- Matplotlib - 子圖示題
- Matplotlib - 影像
- Matplotlib - 影像蒙版
- Matplotlib - 註釋
- Matplotlib - 箭頭
- Matplotlib - 字型
- Matplotlib - 什麼是字型?
- 全域性設定字型屬性
- Matplotlib - 字型索引
- Matplotlib - 字型屬性
- Matplotlib - 刻度
- Matplotlib - 線性和對數刻度
- Matplotlib - 對稱對數和 Logit 刻度
- Matplotlib - LaTeX
- Matplotlib - 什麼是 LaTeX?
- Matplotlib - 用於數學表示式的 LaTeX
- Matplotlib - 註釋中的 LaTeX 文字格式
- Matplotlib - PostScript
- 在註釋中啟用 LaTeX 渲染
- Matplotlib - 數學表示式
- Matplotlib - 動畫
- Matplotlib - 圖形物件
- Matplotlib - 使用 Cycler 進行樣式設定
- Matplotlib - 路徑
- Matplotlib - 路徑效果
- Matplotlib - 座標轉換
- Matplotlib - 刻度和刻度標籤
- Matplotlib - 弧度刻度
- Matplotlib - 日期刻度
- Matplotlib - 刻度格式化器
- Matplotlib - 刻度定位器
- Matplotlib - 基本單位
- Matplotlib - 自動縮放
- Matplotlib - 反轉軸
- Matplotlib - 對數軸
- Matplotlib - Symlog
- Matplotlib - 單位處理
- Matplotlib - 帶有單位的橢圓
- Matplotlib - 脊柱
- Matplotlib - 軸範圍
- Matplotlib - 軸刻度
- Matplotlib - 軸刻度
- Matplotlib - 格式化軸
- Matplotlib - Axes 類
- Matplotlib - 雙軸
- Matplotlib - Figure 類
- Matplotlib - 多圖
- Matplotlib - 網格
- Matplotlib - 面向物件介面
- Matplotlib - PyLab 模組
- Matplotlib - Subplots() 函式
- Matplotlib - Subplot2grid() 函式
- Matplotlib - 固定位置圖形物件
- Matplotlib - 手動等值線
- Matplotlib - 座標報告
- Matplotlib - AGG 過濾器
- Matplotlib - 帶狀框
- Matplotlib - 填充螺旋線
- Matplotlib - findobj 演示
- Matplotlib - 超連結
- Matplotlib - 影像縮圖
- Matplotlib - 使用關鍵字繪圖
- Matplotlib - 建立 Logo
- Matplotlib - 多頁 PDF
- Matplotlib - 多程序
- Matplotlib - 列印標準輸出
- Matplotlib - 複合路徑
- Matplotlib - Sankey 類
- Matplotlib - MRI 與 EEG
- Matplotlib - 樣式表
- Matplotlib - 背景顏色
- Matplotlib - Basemap
- Matplotlib 事件處理
- Matplotlib - 事件處理
- Matplotlib - 關閉事件
- Matplotlib - 滑鼠移動
- Matplotlib - 點選事件
- Matplotlib - 滾動事件
- Matplotlib - 按鍵事件
- Matplotlib - 選擇事件
- Matplotlib - 觀察鏡
- Matplotlib - 路徑編輯器
- Matplotlib - 多邊形編輯器
- Matplotlib - 定時器
- Matplotlib - Viewlims
- Matplotlib - 縮放視窗
- Matplotlib 小部件
- Matplotlib - 游標小部件
- Matplotlib - 帶註釋的游標
- Matplotlib - 按鈕小部件
- Matplotlib - 複選框
- Matplotlib - 套索選擇器
- Matplotlib - 選單小部件
- Matplotlib - 滑鼠游標
- Matplotlib - 多游標
- Matplotlib - 多邊形選擇器
- Matplotlib - 單選按鈕
- Matplotlib - 範圍滑塊
- Matplotlib - 矩形選擇器
- Matplotlib - 橢圓選擇器
- Matplotlib - 滑塊小部件
- Matplotlib - 跨度選擇器
- Matplotlib - 文字框
- Matplotlib 繪圖
- Matplotlib - 條形圖
- Matplotlib - 直方圖
- Matplotlib - 餅圖
- Matplotlib - 散點圖
- Matplotlib - 箱線圖
- Matplotlib - 小提琴圖
- Matplotlib - 等值線圖
- Matplotlib - 3D 繪圖
- Matplotlib - 3D 等值線
- Matplotlib - 3D 線框圖
- Matplotlib - 3D 曲面圖
- Matplotlib - Quiver 圖
- Matplotlib 有用資源
- Matplotlib - 快速指南
- Matplotlib - 有用資源
- Matplotlib - 討論
Matplotlib - findobj 演示
在 Matplotlib 中,findobj 是一種用於定位和操作圖形中圖形物件的方法。其主要目的是提供一種靈活且方便的方式來搜尋特定圖形物件例項並修改其在繪圖中的屬性。
此方法在兩種介面中都可用,例如 pyplot.findobj() 和 axes.Axes.findobj()(pyplot 和麵向物件介面)。Matplotlib 中的所有圖形物件都繼承此方法,允許在其層次結構中進行遞迴搜尋。findobj 方法採用匹配條件,並可以選擇將物件本身包含在搜尋中。
在本教程中,我們將探討 Matplotlib 中 findobj 方法背後的基本概念。
查詢物件
findobj() 方法可用於在繪圖中定位特定型別的物件。例如,使用者可以搜尋 Line2D 例項以識別當前 Axes 中繪製的線條。
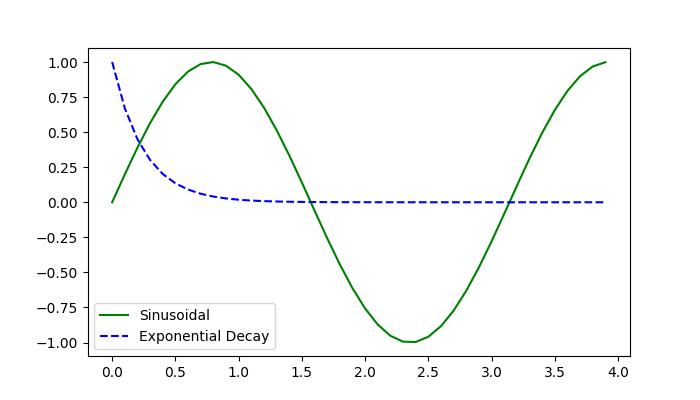
示例
以下示例使用 plot() 方法建立兩組線圖,然後您可以使用 findobj() 方法查詢與正弦線對應的 Line2D 例項。
import matplotlib.pyplot as plt
from matplotlib.lines import Line2D
import numpy as np

# Generate data
t = np.arange(0, 4, 0.1)
F1 = np.sin(2 * t)
F2 = np.exp(-t*4)

# Plot two lines
fig, ax = plt.subplots(figsize=(7, 4))
line1, = ax.plot(t, F1, 'green', label='Sinusoidal')
line2, = ax.plot(t, F2, 'b--', label='Exponential Decay')

# Find the Line object corresponding to the sinusoidal line
line_handle = plt.gca().findobj(Line2D)[0]

# Display the results
print("Found Line2D instance:", line_handle)

# Display the modified plot
plt.legend()
plt.show()
輸出
執行上述程式碼後,我們將獲得以下輸出:
Found Line2D instance: Line2D(Sinusoidal)
修改物件
使用 findobj() 方法找到/識別物件後,使用者可以修改其屬性以實現所需的視覺化效果。這包括更改顏色、線型、文字內容等屬性。
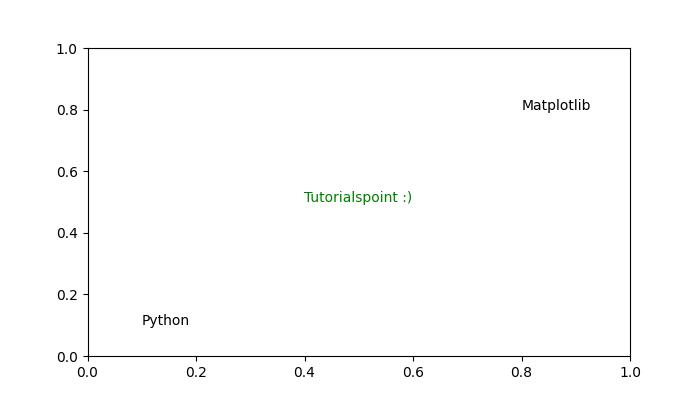
示例 1
這是一個示例,它建立一個包含三個包含不同文字內容的文字物件的繪圖。Axes.findobj() 方法用於查詢具有特定文字內容('tutorialspoint')的文字物件。找到後,文字內容將修改為 'Tutorialspoint :)',其顏色將更改為綠色。
import matplotlib.pyplot as plt
from matplotlib.text import Text

# Create a plot with a text object
fig, ax = plt.subplots()
ax.text(.4, .5, s='tutorialspoint')
ax.text(.1, .1, s='Python')
ax.text(.8, .8, s='Matplotlib')

# Find the Text object with the text 'tutorialspoint'
text_handle = ax.findobj(
   lambda artist: isinstance(artist, Text) and artist.get_text() == 'tutorialspoint')[0]

# Modify the text
text_handle.set_text('Tutorialspoint :)')
text_handle.set_color('green')
plt.show()
輸出
執行上述程式碼後,我們將獲得以下輸出:
使用者還可以定義自定義匹配函式,以根據特定條件篩選物件。這允許更復雜的搜尋,並啟用對圖形物件的更高級別的操作。
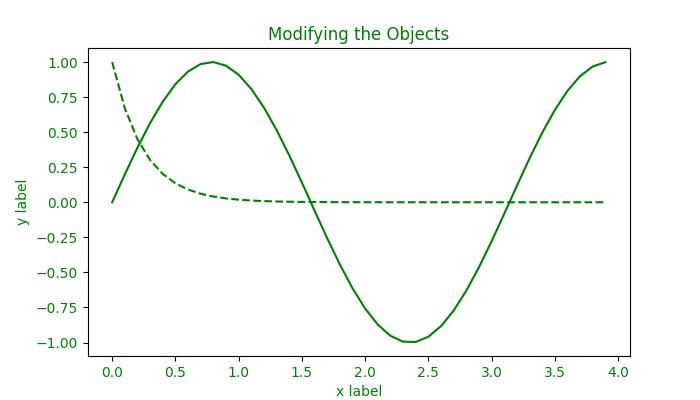
示例 2
這是另一個示例,演示瞭如何使用自定義匹配函式使用 Figure.findobj() 方法修改物件。
import matplotlib.pyplot as plt
import matplotlib.text as text
import numpy as np

# Generate data
t = np.arange(0, 4, 0.1)
F1 = np.sin(2 * t)
F2 = np.exp(-t * 4)

# Plot two lines
fig, ax = plt.subplots(figsize=(7, 4))
line1, = ax.plot(t, F1, 'red', label='Sinusoidal')
line2, = ax.plot(t, F2, 'k--', label='Exponential Decay')

plt.grid(False)
plt.xlabel('x label')
plt.ylabel('y label')
plt.title('Modifying the Objects')

# Define a custom function for matching
def myfunc(x):
   return hasattr(x, 'set_color') and not hasattr(x, 'set_facecolor')

# Modify objects based on the custom function
for o in fig.findobj(myfunc):
   o.set_color('green')

# Display the modified plot
plt.show()
輸出
執行上述程式碼後,我們將獲得以下輸出: