- Matplotlib 基礎
- Matplotlib - 首頁
- Matplotlib - 簡介
- Matplotlib - 與 Seaborn 的比較
- Matplotlib - 環境設定
- Matplotlib - Anaconda 發行版
- Matplotlib - Jupyter Notebook
- Matplotlib - Pyplot API
- Matplotlib - 簡單繪圖
- Matplotlib - 儲存圖片
- Matplotlib - 標記
- Matplotlib - 圖表
- Matplotlib - 樣式
- Matplotlib - 圖例
- Matplotlib - 顏色
- Matplotlib - 顏色對映
- Matplotlib - 顏色對映歸一化
- Matplotlib - 選擇顏色對映
- Matplotlib - 顏色條
- Matplotlib - 文字
- Matplotlib - 文字屬性
- Matplotlib - 子圖示題
- Matplotlib - 圖片
- Matplotlib - 圖片蒙版
- Matplotlib - 註釋
- Matplotlib - 箭頭
- Matplotlib - 字型
- Matplotlib - 什麼是字型?
- 全域性設定字型屬性
- Matplotlib - 字型索引
- Matplotlib - 字型屬性
- Matplotlib - 刻度
- Matplotlib - 線性刻度和對數刻度
- Matplotlib - 對稱對數刻度和logit刻度
- Matplotlib - LaTeX
- Matplotlib - 什麼是LaTeX?
- Matplotlib - LaTeX用於數學表示式
- Matplotlib - 在註釋中使用LaTeX文字格式
- Matplotlib - PostScript
- 啟用註釋中的LaTeX渲染
- Matplotlib - 數學表示式
- Matplotlib - 動畫
- Matplotlib - 繪圖元素
- Matplotlib - 使用Cycler進行樣式設定
- Matplotlib - 路徑
- Matplotlib - 路徑效果
- Matplotlib - 變換
- Matplotlib - 刻度和刻度標籤
- Matplotlib - 弧度刻度
- Matplotlib - 日期刻度
- Matplotlib - 刻度格式化器
- Matplotlib - 刻度定位器
- Matplotlib - 基本單位
- Matplotlib - 自動縮放
- Matplotlib - 反轉座標軸
- Matplotlib - 對數座標軸
- Matplotlib - Symlog
- Matplotlib - 單位處理
- Matplotlib - 帶單位的橢圓
- Matplotlib - 脊柱
- Matplotlib - 座標軸範圍
- Matplotlib - 座標軸刻度
- Matplotlib - 座標軸刻度
- Matplotlib - 格式化座標軸
- Matplotlib - Axes 類
- Matplotlib - 雙座標軸
- Matplotlib - Figure 類
- Matplotlib - 多圖
- Matplotlib - 網格
- Matplotlib - 面向物件介面
- Matplotlib - PyLab 模組
- Matplotlib - Subplots() 函式
- Matplotlib - Subplot2grid() 函式
- Matplotlib - 固定位置的繪圖元素
- Matplotlib - 手動等高線
- Matplotlib - 座標報告
- Matplotlib - AGG 過濾器
- Matplotlib - 帶狀框
- Matplotlib - 填充螺旋線
- Matplotlib - findobj 演示
- Matplotlib - 超連結
- Matplotlib - 圖片縮圖
- Matplotlib - 使用關鍵字繪圖
- Matplotlib - 建立Logo
- Matplotlib - 多頁PDF
- Matplotlib - 多程序
- Matplotlib - 列印標準輸出
- Matplotlib - 複合路徑
- Matplotlib - Sankey 類
- Matplotlib - MRI 與 EEG
- Matplotlib - 樣式表
- Matplotlib - 背景顏色
- Matplotlib - Basemap
- Matplotlib 事件處理
- Matplotlib - 事件處理
- Matplotlib - 關閉事件
- Matplotlib - 滑鼠移動
- Matplotlib - 點選事件
- Matplotlib - 滾動事件
- Matplotlib - 按鍵事件
- Matplotlib - 選擇事件
- Matplotlib - 透視鏡
- Matplotlib - 路徑編輯器
- Matplotlib - 多邊形編輯器
- Matplotlib - 定時器
- Matplotlib - 檢視限制
- Matplotlib - 縮放視窗
- Matplotlib 小部件
- Matplotlib - 游標小部件
- Matplotlib - 帶註釋的游標
- Matplotlib - 按鈕小部件
- Matplotlib - 複選框
- Matplotlib - 套索選擇器
- Matplotlib - 選單小部件
- Matplotlib - 滑鼠游標
- Matplotlib - 多游標
- Matplotlib - 多邊形選擇器
- Matplotlib - 單選按鈕
- Matplotlib - 範圍滑塊
- Matplotlib - 矩形選擇器
- Matplotlib - 橢圓選擇器
- Matplotlib - 滑塊小部件
- Matplotlib - 跨度選擇器
- Matplotlib - 文字框
- Matplotlib 繪圖
- Matplotlib - 條形圖
- Matplotlib - 直方圖
- Matplotlib - 餅圖
- Matplotlib - 散點圖
- Matplotlib - 箱線圖
- Matplotlib - 小提琴圖
- Matplotlib - 等高線圖
- Matplotlib - 3D 繪圖
- Matplotlib - 3D 等高線
- Matplotlib - 3D 線框圖
- Matplotlib - 3D 表面圖
- Matplotlib - 矢羽圖
- Matplotlib 有用資源
- Matplotlib - 快速指南
- Matplotlib - 有用資源
- Matplotlib - 討論
Matplotlib - 滑鼠游標
簡介
Matplotlib 本身沒有特定的滑鼠游標小部件,但是 Matplotlib 庫提供了各種與滑鼠游標互動的機制,允許開發者增強繪圖的互動性。讓我們詳細探討這些方面。
開發者可以利用這些事件來增強繪圖的互動性,跟蹤游標位置並以自定義方式響應使用者操作。更改游標樣式的能力進一步豐富了使用者在探索資料視覺化時的體驗。
處理 Matplotlib 中的滑鼠事件
Matplotlib 提供了mpl_connect函式,它允許我們將回調函式連線到各種事件,例如滑鼠事件。此功能使我們能夠捕獲滑鼠移動、點選以及 Matplotlib 繪圖中的其他互動。
Matplotlib 提供了滑鼠互動的事件處理,允許我們捕獲滑鼠相關的事件,例如按鈕點選、滑鼠移動和滾動。此功能對於建立互動式繪圖至關重要。
以下是 Matplotlib 庫中常見的滑鼠事件,讓我們來看看它們。
button_press_event 和 button_release_event
當按下滑鼠按鈕時觸發button_press_event,當釋放滑鼠時觸發button_release_event。我們可以用它們來捕獲滑鼠按鈕的狀態。
motion_notify_event
當滑鼠移動時觸發此事件。它對於跟蹤滑鼠游標的位置並相應地更新繪圖很有用。
scroll_event
當使用滑鼠滾輪時觸發此事件。它允許我們響應滾動操作。
檢索游標座標
為了獲取繪圖中滑鼠游標的座標,我們可以使用event.xdata和event.ydata屬性,它們分別表示對應於游標位置的資料座標。motion_notify_event通常用於跟蹤滑鼠移動。
顯示游標座標
為了顯示游標座標,我們可以組合使用兩個函式on_mouse_move()和fig.canvas.mpl_connect()。
on_mouse_move(event) - 此函式在滑鼠移動時觸發。它檢查游標是否在繪圖event.inaxes內,然後列印游標座標。
fig.canvas.mpl_connect('motion_notify_event', on_mouse_move) - 此行將滑鼠移動事件連線到on_mouse_move函式。
示例
在這個例子中,我們顯示了 matplotlib 繪圖的游標座標。
import matplotlib.pyplot as plt
# Function to be triggered on mouse movement
def on_mouse_move(event):
   if event.inaxes:
      x_cursor, y_cursor = event.xdata, event.ydata
      print(f"Cursor at x={x_cursor}, y={y_cursor}")
# Creating a figure and axes
fig, ax = plt.subplots()
# Displaying a plot (for illustration)
ax.scatter([1, 2, 3], [4, 5, 6])
# Connecting the mouse movement event to the on_mouse_move function
fig.canvas.mpl_connect('motion_notify_event', on_mouse_move)
plt.show()
輸出
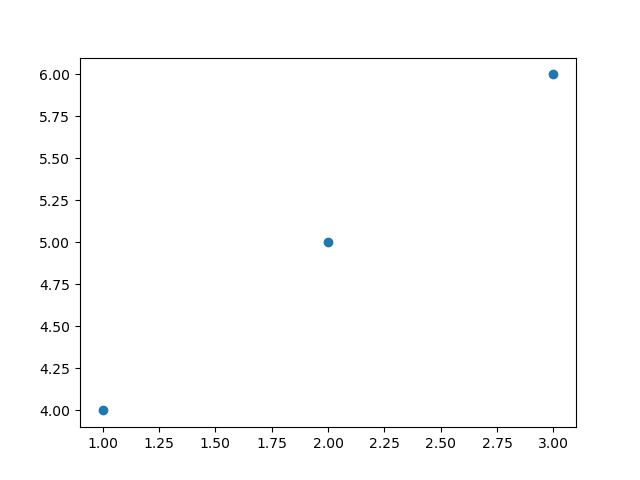
Cursor at x=2.2306451612903224, y=5.127380952380952
Cursor at x=2.23508064516129, y=5.127380952380952
Cursor at x=2.23508064516129, y=5.121428571428572
Cursor at x=2.239516129032258, y=5.121428571428572
Cursor at x=2.2439516129032255, y=5.121428571428572
Cursor at x=2.2483870967741932, y=5.121428571428572
Cursor at x=2.2483870967741932, y=5.1154761904761905
Cursor at x=2.2528225806451614, y=5.1154761904761905
Cursor at x=2.257258064516129, y=5.1154761904761905
----------------------------------------------------
----------------------------------------------------
Cursor at x=2.0, y=5.591666666666667
Cursor at x=2.013306451612903, y=5.728571428571429
Cursor at x=2.013306451612903, y=5.817857142857143
Cursor at x=2.013306451612903, y=5.895238095238096
Cursor at x=2.013306451612903, y=5.966666666666667
Cursor at x=2.0044354838709677, y=6.026190476190476
Cursor at x=1.9955645161290323, y=6.085714285714285
Cursor at x=2.9314516129032255, y=4.014285714285714
響應滑鼠點選
我們還可以使用button_press_event或button_release_event事件來響應滑鼠點選。
import matplotlib.pyplot as plt
# Function to be triggered on mouse click
def on_mouse_click(event):
   if event.inaxes:
      x_click, y_click = event.xdata, event.ydata
      print(f"Mouse clicked at x={x_click}, y={y_click}")
# Creating a figure and axes
fig, ax = plt.subplots()
# Displaying a plot (for illustration)
ax.plot([1, 2, 3], [4, 5, 6])
# Connecting the mouse click event to the on_mouse_click function
fig.canvas.mpl_connect('button_press_event', on_mouse_click)
plt.show()
輸出
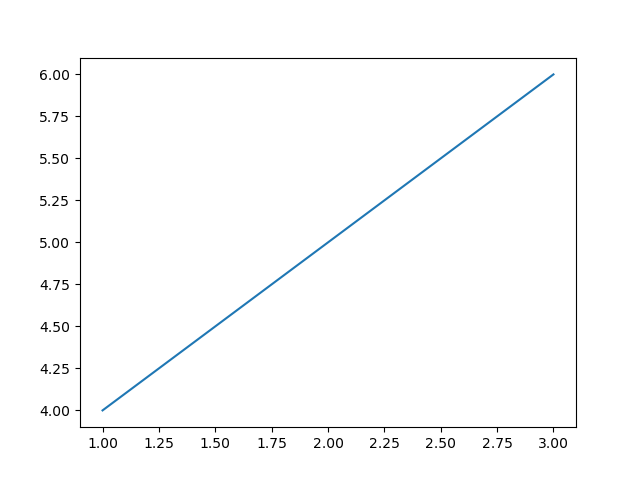
Mouse clicked at x=0.9975806451612903, y=4.002380952380952
Mouse clicked at x=0.9354838709677418, y=5.9904761904761905
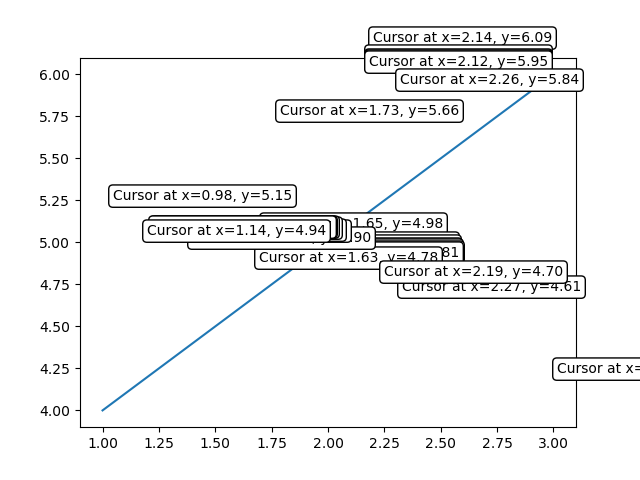
建立自定義滑鼠游標
雖然 Matplotlib 沒有提供特定的滑鼠游標小部件,但我們可以在游標位置建立自定義視覺化或註釋來模擬游標效果。例如,我們可以使用annotate函式在游標移動時動態顯示資訊。
示例
在這個例子中,annotate()函式用於在滑鼠移動時動態顯示游標座標。呼叫plt.draw()方法以即時更新繪圖。
import matplotlib.pyplot as plt
# Function to be triggered on mouse movement
def on_mouse_move(event):
   if event.inaxes:
      x_cursor, y_cursor = event.xdata, event.ydata
      ax.annotate(f'Cursor at x={x_cursor:.2f}, y={y_cursor:.2f}',
         xy=(x_cursor, y_cursor), xytext=(10, 10),
         textcoords='offset points', ha='left', va='bottom',
         bbox=dict(boxstyle='round,pad=0.3', edgecolor='black', facecolor='white'))
      plt.draw()
# Creating a figure and axes
fig, ax = plt.subplots()
# Displaying a plot (for illustration)
ax.plot([1, 2, 3], [4, 5, 6])
# Connecting the mouse movement event to the on_mouse_move function
fig.canvas.mpl_connect('motion_notify_event', on_mouse_move)
plt.show()
輸出
用例
以下是滑鼠小部件的用例。
互動式資料探索 - 跟蹤滑鼠游標位置允許使用者互動式地探索繪圖上的資料點。
座標選擇 - 透過捕獲滑鼠點選,我們可以使使用者能夠選擇特定的座標或感興趣的區域。
自定義互動 - 利用滑鼠事件,我們可以根據使用者操作(例如突出顯示資料點或觸發特定函式)實現自定義互動。