- Matplotlib 基礎
- Matplotlib - 首頁
- Matplotlib - 簡介
- Matplotlib - 與 Seaborn 的比較
- Matplotlib - 環境設定
- Matplotlib - Anaconda 發行版
- Matplotlib - Jupyter Notebook
- Matplotlib - Pyplot API
- Matplotlib - 簡單繪圖
- Matplotlib - 儲存圖形
- Matplotlib - 標記
- Matplotlib - 圖形
- Matplotlib - 樣式
- Matplotlib - 圖例
- Matplotlib - 顏色
- Matplotlib - 色圖
- Matplotlib - 色圖歸一化
- Matplotlib - 選擇色圖
- Matplotlib - 色條
- Matplotlib - 文字
- Matplotlib - 文字屬性
- Matplotlib - 子圖示題
- Matplotlib - 影像
- Matplotlib - 影像蒙版
- Matplotlib - 註釋
- Matplotlib - 箭頭
- Matplotlib - 字型
- Matplotlib - 什麼是字型?
- 全域性設定字型屬性
- Matplotlib - 字型索引
- Matplotlib - 字型屬性
- Matplotlib - 刻度
- Matplotlib - 線性和對數刻度
- Matplotlib - 對稱對數和 Logit 刻度
- Matplotlib - LaTeX
- Matplotlib - 什麼是 LaTeX?
- Matplotlib - LaTeX 用於數學表示式
- Matplotlib - LaTeX 在註釋中的文字格式
- Matplotlib - PostScript
- 在註釋中啟用 LaTeX 渲染
- Matplotlib - 數學表示式
- Matplotlib - 動畫
- Matplotlib - 圖形物件
- Matplotlib - 使用 Cycler 進行樣式設定
- Matplotlib - 路徑
- Matplotlib - 路徑效果
- Matplotlib - 變換
- Matplotlib - 刻度和刻度標籤
- Matplotlib - 弧度刻度
- Matplotlib - 日期刻度
- Matplotlib - 刻度格式化器
- Matplotlib - 刻度定位器
- Matplotlib - 基本單位
- Matplotlib - 自動縮放
- Matplotlib - 反轉座標軸
- Matplotlib - 對數座標軸
- Matplotlib - Symlog
- Matplotlib - 單位處理
- Matplotlib - 帶單位的橢圓
- Matplotlib - 脊柱
- Matplotlib - 座標軸範圍
- Matplotlib - 座標軸刻度
- Matplotlib - 座標軸刻度
- Matplotlib - 格式化座標軸
- Matplotlib - Axes 類
- Matplotlib - 雙座標軸
- Matplotlib - Figure 類
- Matplotlib - 多圖
- Matplotlib - 網格
- Matplotlib - 面向物件介面
- Matplotlib - PyLab 模組
- Matplotlib - Subplots() 函式
- Matplotlib - Subplot2grid() 函式
- Matplotlib - 固定位置圖形物件
- Matplotlib - 手動等值線
- Matplotlib - 座標報告
- Matplotlib - AGG 過濾器
- Matplotlib - 帶狀框
- Matplotlib - 填充螺旋線
- Matplotlib - Findobj 演示
- Matplotlib - 超連結
- Matplotlib - 影像縮圖
- Matplotlib - 使用關鍵字繪圖
- Matplotlib - 建立 Logo
- Matplotlib - 多頁 PDF
- Matplotlib - 多程序
- Matplotlib - 列印標準輸出
- Matplotlib - 複合路徑
- Matplotlib - Sankey 類
- Matplotlib - MRI 與 EEG
- Matplotlib - 樣式表
- Matplotlib - 背景顏色
- Matplotlib - Basemap
- Matplotlib 事件處理
- Matplotlib - 事件處理
- Matplotlib - 關閉事件
- Matplotlib - 滑鼠移動
- Matplotlib - 點選事件
- Matplotlib - 滾動事件
- Matplotlib - 按鍵事件
- Matplotlib - 選擇事件
- Matplotlib - 觀察鏡
- Matplotlib - 路徑編輯器
- Matplotlib - 多邊形編輯器
- Matplotlib - 定時器
- Matplotlib - Viewlims
- Matplotlib - 縮放視窗
- Matplotlib 小部件
- Matplotlib - 遊標小部件
- Matplotlib - 帶註釋的遊標
- Matplotlib - 按鈕小部件
- Matplotlib - 複選框
- Matplotlib - 套索選擇器
- Matplotlib - 選單小部件
- Matplotlib - 滑鼠游標
- Matplotlib - 多遊標
- Matplotlib - 多邊形選擇器
- Matplotlib - 單選按鈕
- Matplotlib - 範圍滑塊
- Matplotlib - 矩形選擇器
- Matplotlib - 橢圓選擇器
- Matplotlib - 滑塊小部件
- Matplotlib - 跨度選擇器
- Matplotlib - 文字框
- Matplotlib 繪圖
- Matplotlib - 條形圖
- Matplotlib - 直方圖
- Matplotlib - 餅圖
- Matplotlib - 散點圖
- Matplotlib - 箱線圖
- Matplotlib - 小提琴圖
- Matplotlib - 等值線圖
- Matplotlib - 3D 繪圖
- Matplotlib - 3D 等值線
- Matplotlib - 3D 線框圖
- Matplotlib - 3D 曲面圖
- Matplotlib - Quiver 圖
- Matplotlib 有用資源
- Matplotlib - 快速指南
- Matplotlib - 有用資源
- Matplotlib - 討論
Matplotlib - 事件處理
在一般的程式設計中,**事件**被定義為物件狀態的改變,當用戶與圖形使用者介面元件互動時發生,從而觸發應用程式的響應。例如點選按鈕、移動滑鼠、在鍵盤上打字、從列表中選擇專案或滾動頁面——這些活動都是事件,描述了源狀態的改變。
而**事件處理**是互動式軟體應用程式的支柱。它是一種控制對這些事件響應的機制,確定特定事件發生時應該發生什麼。
Matplotlib 中的事件處理
Matplotlib 與各種使用者介面工具包協同工作,包括 wxPython、Tkinter、Qt、GTK 和 MacOSX。為了確保跨不同介面的平移和縮放等互動式功能的一致支援,Matplotlib 使用了**GUI 中立**的事件處理 API。這個 API 最初基於**GTK** 模型,它是 Matplotlib 支援的第一個使用者介面。
連線到事件
Matplotlib 中**事件處理**的主要思想是將回調函式連線到事件。當發生特定事件(例如滑鼠點選或按鍵)時,回撥函式會被執行。這種機制使你能夠響應使用者互動並實現自定義行為。
如果需要,你可以使用從 mpl_connect 方法獲得的連線 ID 斷開回調。
fig.canvas.mpl_disconnect(cid)
示例
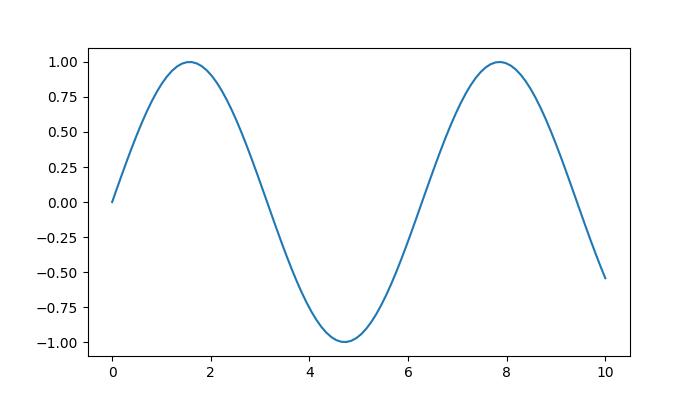
此示例演示了一個基本實現,它在 Matplotlib 繪圖上列印滑鼠點選位置和按下的按鈕。
import matplotlib.pyplot as plt
import numpy as np

# Generate sample data
x = np.linspace(0, 10, 100)
y = np.sin(x)

# Create a Matplotlib figure and axis
fig, ax = plt.subplots(figsize=(7, 4))

# Plot the data
ax.plot(x, y)

# Define a callback function to handle events
def onclick(event):
   print('%s click: button=%d, x=%d, y=%d, xdata=%f, ydata=%f' %
      ('double' if event.dblclick else 'single', event.button,
      event.x, event.y, event.xdata, event.ydata))

# Connect the event handler to the figure canvas
cid = fig.canvas.mpl_connect('button_press_event', onclick)

plt.show()
輸出
執行上述程式後,你將獲得以下輸出:
single click: button=1, x=271, y=266, xdata=3.220737, ydata=0.485644
single click: button=1, x=218, y=226, xdata=2.146083, ydata=0.200062
single click: button=3, x=218, y=226, xdata=2.146083, ydata=0.200062
single click: button=1, x=360, y=245, xdata=5.025346, ydata=0.335713
觀看下面的影片以觀察此示例的工作原理。

Matplotlib 中的常見事件
Matplotlib 支援各種事件,每個事件都由一個特定的類表示:
**button_press_event** - 當按下滑鼠按鈕時觸發。
**button_release_event** - 當釋放滑鼠按鈕時觸發。
**close_event** - 當圖形關閉時觸發。
**draw_event** - 當畫布已繪製但螢幕小部件尚未更新時觸發。
**key_press_event** - 當按下鍵時觸發。
**key_release_event** - 當釋放鍵時觸發。
**motion_notify_event** - 當滑鼠移動時觸發。
**pick_event** - 當選擇畫布中的圖形物件時觸發。
**resize_event** - 當圖形畫布大小調整時觸發。
**scroll_event** - 當滾動滑鼠滾輪時觸發。
**figure_enter_event** - 當滑鼠進入新圖形時觸發。
**figure_leave_event** - 當滑鼠離開圖形時觸發。
**axes_enter_event** - 當滑鼠進入新的座標軸時觸發。
**axes_leave_event** - 當滑鼠離開座標軸時觸發。
透過使用這些事件,你可以在 matplotlib 中建立動態和互動式的視覺化效果。
事件屬性
所有 Matplotlib 事件都繼承自**matplotlib.backend_bases.Event** 類,該類具有**name**、**canvas** 和**guiEvent** 等屬性。**MouseEvent** 的常見屬性包括**x**、**y**、**inaxes**、**xdata** 和**ydata**。
示例
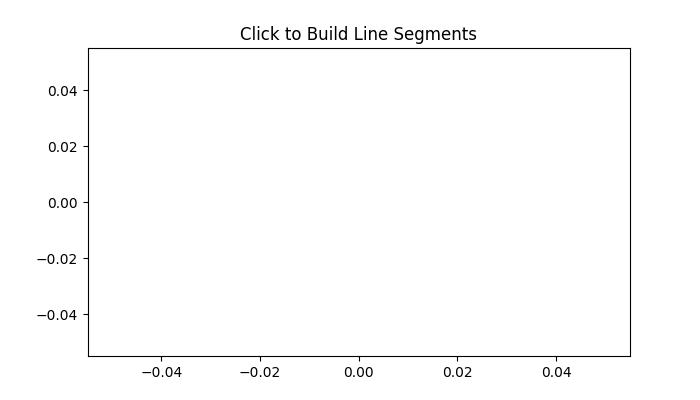
讓我們看看這個簡單的示例,其中在繪圖上每次滑鼠按下都會生成一條線段。
from matplotlib import pyplot as plt
import numpy as np

# LineBuilder Class
# It creats line segments based on mouse clicks.
class LineBuilder:
   def __init__(self, line):
      self.line = line
      self.xs = list(line.get_xdata())
      self.ys = list(line.get_ydata())
      self.cid = line.figure.canvas.mpl_connect('button_press_event', self)

   def __call__(self, event):
      if event.inaxes != self.line.axes:
         return
      self.xs.append(event.xdata)
      self.ys.append(event.ydata)
      self.line.set_data(self.xs, self.ys)
      self.line.figure.canvas.draw()

# Create a figure and axis
fig, ax = plt.subplots(figsize=(7, 4))

# Set the title
ax.set_title('Click to Build Line Segments')

# empty line
line, = ax.plot([0], [0])

# Create an instance for LineBuilder class
linebuilder = LineBuilder(line)

# Show the Plot
plt.show()
輸出
執行上述程式後,你將獲得以下圖形,點選此圖形以觀察此示例的工作原理:
觀看下面的影片以觀察此示例的工作原理。

檢測滑鼠移動
要檢測滑鼠何時進入或離開圖形或座標軸,我們可以連線到圖形/座標軸進入/離開事件。
示例
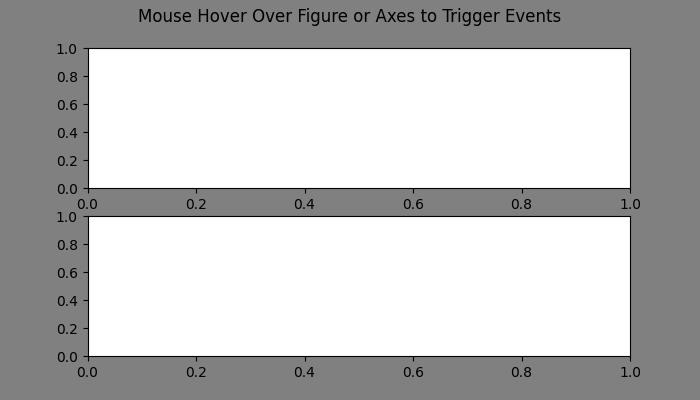
以下是一個示例,演示瞭如何在滑鼠進入或離開圖形的特定區域時更改框架顏色。
import matplotlib.pyplot as plt

def enter_axes(event):
   event.inaxes.patch.set_facecolor('yellow')
   event.canvas.draw()

def leave_axes(event):
   event.inaxes.patch.set_facecolor('white')
   event.canvas.draw()

def enter_figure(event):
   event.canvas.figure.patch.set_facecolor('red')
   event.canvas.draw()

def leave_figure(event):
   event.canvas.figure.patch.set_facecolor('grey')
   event.canvas.draw()

fig, axs = plt.subplots(2, figsize=(7, 4))
fig.suptitle('Mouse Hover Over Figure or Axes to Trigger Events')

fig.canvas.mpl_connect('figure_enter_event', enter_figure)
fig.canvas.mpl_connect('figure_leave_event', leave_figure)
fig.canvas.mpl_connect('axes_enter_event', enter_axes)
fig.canvas.mpl_connect('axes_leave_event', leave_axes)

plt.show()
輸出
執行上述程式後,你將獲得以下輸出:
觀看下面的影片以觀察此示例的工作原理。

示例
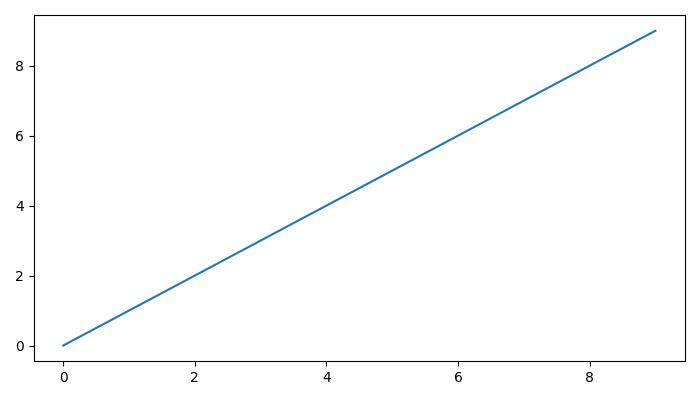
以下是一個示例,演示瞭如何使用 Matplotlib 顯示滑鼠釋放事件座標
from matplotlib import pyplot as plt

plt.rcParams['backend'] = 'TkAgg'
plt.rcParams["figure.figsize"] = [7, 4]
plt.rcParams["figure.autolayout"] = True

# Define a callback function to handle events
def onclick(event):
   print(event.button, event.xdata, event.ydata)

# Create a Matplotlib figure and axis
fig, ax = plt.subplots()

# Plot the data
ax.plot(range(10))

# Connect the event handler to the figure canvas
fig.canvas.mpl_connect('button_release_event', onclick)

# Show the Plot
plt.show()
輸出
執行上述程式碼後,我們將獲得以下輸出:
觀看下面的影片以觀察此示例的工作原理。
