- Matplotlib 基礎
- Matplotlib - 首頁
- Matplotlib - 簡介
- Matplotlib - Vs Seaborn
- Matplotlib - 環境設定
- Matplotlib - Anaconda 發行版
- Matplotlib - Jupyter Notebook
- Matplotlib - Pyplot API
- Matplotlib - 簡單繪圖
- Matplotlib - 儲存圖形
- Matplotlib - 標記
- Matplotlib - 圖形
- Matplotlib - 樣式
- Matplotlib - 圖例
- Matplotlib - 顏色
- Matplotlib - 色圖
- Matplotlib - 色圖歸一化
- Matplotlib - 選擇色圖
- Matplotlib - 色標
- Matplotlib - 文字
- Matplotlib - 文字屬性
- Matplotlib - 子圖示題
- Matplotlib - 影像
- Matplotlib - 影像掩碼
- Matplotlib - 註釋
- Matplotlib - 箭頭
- Matplotlib - 字型
- Matplotlib - 什麼是字型?
- 全域性設定字型屬性
- Matplotlib - 字型索引
- Matplotlib - 字型屬性
- Matplotlib - 刻度
- Matplotlib - 線性和對數刻度
- Matplotlib - 對稱對數和 Logit 刻度
- Matplotlib - LaTeX
- Matplotlib - 什麼是 LaTeX?
- Matplotlib - LaTeX 用於數學表示式
- Matplotlib - LaTeX 在註釋中的文字格式
- Matplotlib - PostScript
- 在註釋中啟用 LaTeX 渲染
- Matplotlib - 數學表示式
- Matplotlib - 動畫
- Matplotlib - 圖形物件
- Matplotlib - 使用 Cycler 樣式化
- Matplotlib - 路徑
- Matplotlib - 路徑效果
- Matplotlib - 變換
- Matplotlib - 刻度和刻度標籤
- Matplotlib - 弧度刻度
- Matplotlib - 日期刻度
- Matplotlib - 刻度格式化程式
- Matplotlib - 刻度定位器
- Matplotlib - 基本單位
- Matplotlib - 自動縮放
- Matplotlib - 反轉軸
- Matplotlib - 對數軸
- Matplotlib - Symlog
- Matplotlib - 單位處理
- Matplotlib - 帶單位的橢圓
- Matplotlib - 脊柱
- Matplotlib - 軸範圍
- Matplotlib - 軸刻度
- Matplotlib - 軸刻度
- Matplotlib - 格式化軸
- Matplotlib - Axes 類
- Matplotlib - 雙軸
- Matplotlib - Figure 類
- Matplotlib - 多圖
- Matplotlib - 網格
- Matplotlib - 面向物件介面
- Matplotlib - PyLab 模組
- Matplotlib - Subplots() 函式
- Matplotlib - Subplot2grid() 函式
- Matplotlib - 固定圖形物件
- Matplotlib - 手動等值線
- Matplotlib - 座標報告
- Matplotlib - AGG 過濾器
- Matplotlib - 飄帶框
- Matplotlib - 填充螺旋
- Matplotlib - Findobj 演示
- Matplotlib - 超連結
- Matplotlib - 影像縮圖
- Matplotlib - 使用關鍵字繪圖
- Matplotlib - 建立 Logo
- Matplotlib - 多頁 PDF
- Matplotlib - 多程序
- Matplotlib - 列印標準輸出
- Matplotlib - 複合路徑
- Matplotlib - Sankey 類
- Matplotlib - MRI 與 EEG
- Matplotlib - 樣式表
- Matplotlib - 背景顏色
- Matplotlib - Basemap
- Matplotlib 事件處理
- Matplotlib - 事件處理
- Matplotlib - 關閉事件
- Matplotlib - 滑鼠移動
- Matplotlib - 點選事件
- Matplotlib - 滾動事件
- Matplotlib - 按鍵事件
- Matplotlib - 選擇事件
- Matplotlib - 放大鏡
- Matplotlib - 路徑編輯器
- Matplotlib - 多邊形編輯器
- Matplotlib - 定時器
- Matplotlib - Viewlims
- Matplotlib - 縮放視窗
- Matplotlib 小部件
- Matplotlib - 游標小部件
- Matplotlib - 帶註釋的游標
- Matplotlib - 按鈕小部件
- Matplotlib - 複選框
- Matplotlib - 套索選擇器
- Matplotlib - 選單小部件
- Matplotlib - 滑鼠游標
- Matplotlib - 多游標
- Matplotlib - 多邊形選擇器
- Matplotlib - 單選按鈕
- Matplotlib - 範圍滑塊
- Matplotlib - 矩形選擇器
- Matplotlib - 橢圓選擇器
- Matplotlib - 滑塊小部件
- Matplotlib - 跨度選擇器
- Matplotlib - 文字框
- Matplotlib 繪圖
- Matplotlib - 條形圖
- Matplotlib - 直方圖
- Matplotlib - 餅圖
- Matplotlib - 散點圖
- Matplotlib - 箱線圖
- Matplotlib - 小提琴圖
- Matplotlib - 等值線圖
- Matplotlib - 3D 繪圖
- Matplotlib - 3D 等值線
- Matplotlib - 3D 線框圖
- Matplotlib - 3D 曲面圖
- Matplotlib - Quiver 圖
- Matplotlib 有用資源
- Matplotlib - 快速指南
- Matplotlib - 有用資源
- Matplotlib - 討論
Matplotlib - 滾動事件
通常,滾動事件發生在使用者與滑鼠滾輪互動時。滑鼠中間的滾輪用於在任何頁面上上下滾動,而無需使用文件或網頁右側的垂直捲軸。在本教程中,我們將探討 Matplotlib 中的滾動事件處理。
Matplotlib 中的滾動事件
Matplotlib 提供了一種透過MouseEvent類處理滾動事件的機制。當用戶滾動滑鼠滾輪時,會觸發此scroll_event事件。它用於為繪圖中的互動式導航或縮放提供機制。
示例
這是一個簡單的示例,它檢測滾動事件並根據使用者向上或向下滾動滑鼠滾輪顯示訊息。import matplotlib.pyplot as plt
import numpy as np
def on_scroll(event):
if event.button == 'up':
print('Scroll Up Event Triggered..')
elif event.button == 'down':
print('Scroll Down Event Triggered..')
# Create a figure and axis
fig, ax = plt.subplots()
ax.text(0.13, 0.5, 'Scroll Mouse Wheel on me!', dict(size=20))
# Connect the on_scroll method to the scroll_event
fig.canvas.mpl_connect('scroll_event', on_scroll)
plt.show()
輸出
執行上述程式碼後,我們將得到以下輸出 -
Scroll Up Event Triggered..
Scroll Up Event Triggered..
Scroll Down Event Triggered..
Scroll Up Event Triggered..
Scroll Down Event Triggered..
Scroll Up Event Triggered..
Scroll Up Event Triggered..
觀看下面的影片,觀察此滾動事件功能在此處的執行方式。

使用滾動事件縮放
Matplotlib 中的滾動事件可用於動態縮放繪圖。透過將滾動事件連線到可呼叫函式,使用者可以動態調整繪圖內的檢視。
示例
讓我們看看一個演示如何使用滾動事件實現縮放功能的示例。
import matplotlib.pyplot as plt

def zoom_factory(axs, base_scale=2.):
   def zoom_fun(event):
      # get the current x and y limits
      cur_xlim = axs.get_xlim()
      cur_ylim = axs.get_ylim()
      cur_xrange = (cur_xlim[1] - cur_xlim[0]) * 0.2
      cur_yrange = (cur_ylim[1] - cur_ylim[0]) * 0.2

      # get event x location
      xdata = event.xdata
      ydata = event.ydata

      if event.button == 'up':
         # deal with zoom in
         scale_factor = 1/base_scale
      elif event.button == 'down':
         # deal with zoom out
         scale_factor = base_scale
      else:
         # deal with something that should never happen
         scale_factor = 1
         print(event.button)

      # set new limits
      axs.set_xlim([xdata - cur_xrange*scale_factor,
         xdata + cur_xrange*scale_factor])
      axs.set_ylim([ydata - cur_yrange*scale_factor,
         ydata + cur_yrange*scale_factor])

      # force re-draw
      plt.draw()

   # get the figure of interest
   fig = axs.get_figure()

   # Connect the call back function to the scroll_event
   fig.canvas.mpl_connect('scroll_event', zoom_fun)

   # return the function
   return zoom_fun

# Example Usage
fig, axs = plt.subplots(figsize=(7, 4))
axs.plot(range(100))
scale = 1.5
f = zoom_factory(axs, base_scale=scale)
plt.show()
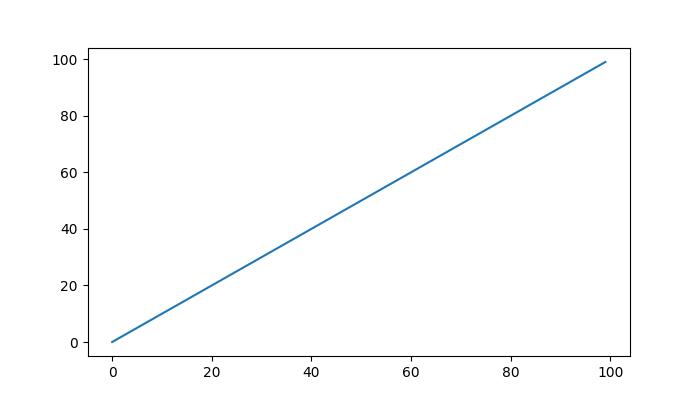
輸出
執行上述程式後,您將獲得以下圖形,滾動滑鼠滾輪以觀察此繪圖中的縮放效果 -
觀看下面的影片,觀察此滾動事件功能在此處的執行方式。

透過影像進行互動式滾動
Matplotlib 中的滾動事件還可以應用於互動式滾動一系列影像。當瀏覽多維資料集或影像集合時,此功能特別有用。
示例
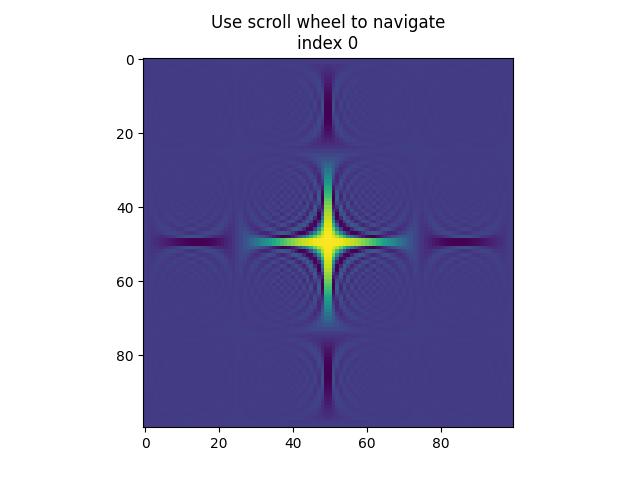
此示例建立了一個 IndexTracker 類,以使用滾動事件瀏覽一系列 2D 切片。on_scroll 方法根據滾動方向調整索引,然後更新並顯示影像。
import matplotlib.pyplot as plt
import numpy as np

class IndexTracker:
   def __init__(self, axs, X):
      self.index = 0
      self.X = X
      self.axs = axs
      self.im = axs.imshow(self.X[:, :, self.index])
      self.update()

   def on_scrolling(self, event):
      print(event.button, event.step)
      increment = 1 if event.button == 'up' else -1
      maxs_index = self.X.shape[-1] - 1
      self.index = np.clip(self.index + increment, 0, maxs_index)
      self.update()

   def update(self):
      self.im.set_data(self.X[:, :, self.index])
      self.axs.set_title(
         f'Use scroll wheel to navigate\nindex {self.index}')
      self.im.axes.figure.canvas.draw()

# 3D data
x, y, z = np.ogrid[-25:25:100j, -25:25:100j, 1:50:100j]
X = np.sin(x * y * z) / (x * y * z)

# Create a figure
fig, axs = plt.subplots()
tracker = IndexTracker(axs, X)

fig.canvas.mpl_connect('scroll_event', tracker.on_scrolling)
plt.show()
輸出
執行上述程式後,您將獲得以下圖形,滾動滑鼠滾輪以觀察此示例的工作原理 -
up 1.0
up 2.0
down -1.0
down -2.0
down -1.0
up 1.0
up 1.0
down -1.0
down -1.0
up 1.0
up 3.0
down -1.0
down -3.0
觀看下面的影片,觀察此滾動事件功能在此處的執行方式。

廣告