- Matplotlib 基礎
- Matplotlib - 首頁
- Matplotlib - 簡介
- Matplotlib - 與 Seaborn 的比較
- Matplotlib - 環境設定
- Matplotlib - Anaconda 發行版
- Matplotlib - Jupyter Notebook
- Matplotlib - Pyplot API
- Matplotlib - 簡單繪圖
- Matplotlib - 儲存圖形
- Matplotlib - 標記
- Matplotlib - 圖形
- Matplotlib - 樣式
- Matplotlib - 圖例
- Matplotlib - 顏色
- Matplotlib - 色圖
- Matplotlib - 色圖歸一化
- Matplotlib - 選擇色圖
- Matplotlib - 色條
- Matplotlib - 文字
- Matplotlib - 文字屬性
- Matplotlib - 子圖示題
- Matplotlib - 影像
- Matplotlib - 影像蒙版
- Matplotlib - 註釋
- Matplotlib - 箭頭
- Matplotlib - 字型
- Matplotlib - 什麼是字型?
- 全域性設定字型屬性
- Matplotlib - 字型索引
- Matplotlib - 字型屬性
- Matplotlib - 比例尺
- Matplotlib - 線性和對數比例尺
- Matplotlib - 對稱對數和 Logit 比例尺
- Matplotlib - LaTeX
- Matplotlib - 什麼是 LaTeX?
- Matplotlib - LaTeX 用於數學表示式
- Matplotlib - LaTeX 在註釋中的文字格式
- Matplotlib - PostScript
- 在註釋中啟用 LaTeX 渲染
- Matplotlib - 數學表示式
- Matplotlib - 動畫
- Matplotlib - 圖形物件
- Matplotlib - 使用 Cycler 進行樣式設定
- Matplotlib - 路徑
- Matplotlib - 路徑效果
- Matplotlib - 座標轉換
- Matplotlib - 刻度和刻度標籤
- Matplotlib - 弧度刻度
- Matplotlib - 日期刻度
- Matplotlib - 刻度格式化器
- Matplotlib - 刻度定位器
- Matplotlib - 基本單位
- Matplotlib - 自動縮放
- Matplotlib - 反轉座標軸
- Matplotlib - 對數座標軸
- Matplotlib - Symlog
- Matplotlib - 單位處理
- Matplotlib - 帶單位的橢圓
- Matplotlib - 脊柱
- Matplotlib - 座標軸範圍
- Matplotlib - 座標軸比例尺
- Matplotlib - 座標軸刻度
- Matplotlib - 格式化座標軸
- Matplotlib - Axes 類
- Matplotlib - 雙座標軸
- Matplotlib - Figure 類
- Matplotlib - 多圖
- Matplotlib - 網格
- Matplotlib - 面向物件介面
- Matplotlib - PyLab 模組
- Matplotlib - Subplots() 函式
- Matplotlib - Subplot2grid() 函式
- Matplotlib - 固定圖形物件
- Matplotlib - 手動等值線
- Matplotlib - 座標報告
- Matplotlib - AGG 過濾器
- Matplotlib - 帶狀框
- Matplotlib - 填充螺旋線
- Matplotlib - Findobj 演示
- Matplotlib - 超連結
- Matplotlib - 影像縮圖
- Matplotlib - 使用關鍵字繪圖
- Matplotlib - 建立 Logo
- Matplotlib - 多頁 PDF
- Matplotlib - 多程序
- Matplotlib - 列印標準輸出
- Matplotlib - 複合路徑
- Matplotlib - Sankey 類
- Matplotlib - MRI 與 EEG
- Matplotlib - 樣式表
- Matplotlib - 背景顏色
- Matplotlib - Basemap
- Matplotlib 事件處理
- Matplotlib - 事件處理
- Matplotlib - 關閉事件
- Matplotlib - 滑鼠移動
- Matplotlib - 點選事件
- Matplotlib - 滾動事件
- Matplotlib - 按鍵事件
- Matplotlib - 選擇事件
- Matplotlib - 放大鏡
- Matplotlib - 路徑編輯器
- Matplotlib - 多邊形編輯器
- Matplotlib - 定時器
- Matplotlib - Viewlims
- Matplotlib - 縮放視窗
- Matplotlib 小部件
- Matplotlib - 遊標小部件
- Matplotlib - 帶註釋的遊標
- Matplotlib - 按鈕小部件
- Matplotlib - 複選框
- Matplotlib - 套索選擇器
- Matplotlib - 選單小部件
- Matplotlib - 滑鼠游標
- Matplotlib - 多遊標
- Matplotlib - 多邊形選擇器
- Matplotlib - 單選按鈕
- Matplotlib - 範圍滑塊
- Matplotlib - 矩形選擇器
- Matplotlib - 橢圓選擇器
- Matplotlib - 滑塊小部件
- Matplotlib - 跨度選擇器
- Matplotlib - 文字框
- Matplotlib 繪圖
- Matplotlib - 條形圖
- Matplotlib - 直方圖
- Matplotlib - 餅圖
- Matplotlib - 散點圖
- Matplotlib - 箱線圖
- Matplotlib - 小提琴圖
- Matplotlib - 等值線圖
- Matplotlib - 3D 繪圖
- Matplotlib - 3D 等值線
- Matplotlib - 3D 線框圖
- Matplotlib - 3D 表面圖
- Matplotlib - Quiver 圖
- Matplotlib 有用資源
- Matplotlib - 快速指南
- Matplotlib - 有用資源
- Matplotlib - 討論
Matplotlib - 刻度定位器
在一般的圖形和繪圖中,刻度在透過小線段表示 x 和 y 軸的比例尺方面起著至關重要的作用,提供了對相關值的清晰指示。另一方面,刻度定位器定義了這些刻度沿軸線的位置,提供了比例尺的視覺表示。
下圖顯示了圖形上的主刻度和次刻度 -
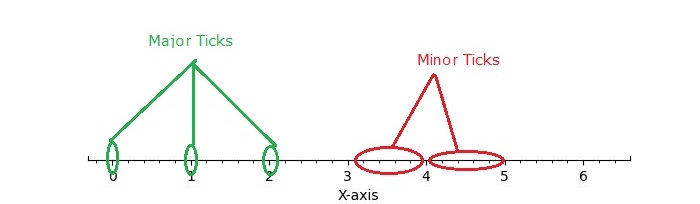
Matplotlib 中的刻度定位器
Matplotlib 提供了一種透過其刻度定位器來控制軸上刻度位置的機制。matplotlib.ticker 模組包含用於配置刻度定位和格式化的類。這些類包括通用刻度定位器、格式化器和特定於領域的自定義刻度定位器。雖然定位器不知道主刻度或次刻度,但它們由 Axis 類使用以支援主刻度和次刻度的定位和格式化。
不同的刻度定位器
matplotlib 在其 ticker 模組中提供了不同的刻度定位器,允許使用者自定義軸上的刻度位置。一些刻度定位器包括 -
- AutoLocator
- MaxNLocator
- LinearLocator
- LogLocator
- MultipleLocator
- FixedLocator
- IndexLocator
- NullLocator
- SymmetricalLogLocator
- AsinhLocator
- LogitLocator
- AutoMinorLocator
- 定義自定義定位器
基本設定
在深入研究特定的刻度定位器之前,讓我們建立一個通用的設定函式來繪製帶有刻度的圖形。
import matplotlib.pyplot as plt
import numpy as np
import matplotlib.ticker as ticker

def draw_ticks(ax, title):
   # it shows the bottom spine only
   ax.yaxis.set_major_locator(ticker.NullLocator())
   ax.spines[['left', 'right', 'top']].set_visible(False)

   ax.xaxis.set_ticks_position('bottom')
   ax.tick_params(which='major', width=1.00, length=5)
   ax.tick_params(which='minor', width=0.75, length=2.5)
   ax.set_xlim(0, 5)
   ax.set_ylim(0, 1)
   ax.text(0.0, 0.2, title, transform=ax.transAxes,
      fontsize=14, fontname='Monospace', color='tab:blue')
現在,讓我們探索每個刻度定位器的運作方式。
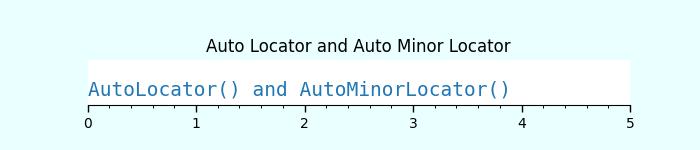
自動定位器
AutoLocator 和 AutoMinorLocator 分別用於自動確定軸上主刻度和次刻度的位置。
示例
此示例演示瞭如何使用 AutoLocator 和 AutoMinorLocator 自動處理軸上主刻度和次刻度的位置。
# Auto Locator
fig, ax = plt.subplots(1,1,figsize=(7,1.5), facecolor='#eaffff')
plt.subplots_adjust(bottom=0.3, top=0.6, wspace=0.2, hspace=0.4)
draw_ticks(ax, title="AutoLocator() and AutoMinorLocator()")
ax.xaxis.set_major_locator(ticker.AutoLocator())
ax.xaxis.set_minor_locator(ticker.AutoMinorLocator())
ax.set_title('Auto Locator and Auto Minor Locator')
plt.show()
輸出
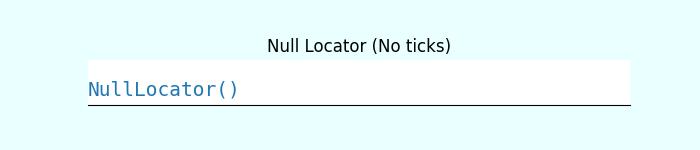
空定位器
NullLocator 不會在軸上放置任何刻度。
示例
讓我們看看以下 NullLocator 的工作示例。
# Null Locator
fig, ax = plt.subplots(1,1,figsize=(7,1.5), facecolor='#eaffff')
plt.subplots_adjust(bottom=0.3, top=0.6, wspace=0.2, hspace=0.4)
draw_ticks(ax, title="NullLocator()")
ax.xaxis.set_major_locator(ticker.NullLocator())
ax.xaxis.set_minor_locator(ticker.NullLocator())
ax.set_title('Null Locator (No ticks)')
plt.show()
輸出
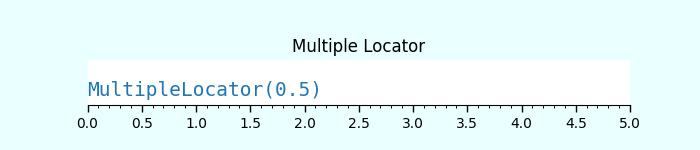
多重定位器
MultipleLocator() 類允許刻度位於指定基數的倍數處,支援整數和浮點值。
示例
以下示例演示瞭如何使用 MultipleLocator() 類。
# Multiple Locator
fig, ax = plt.subplots(1,1,figsize=(7,1.5), facecolor='#eaffff')
plt.subplots_adjust(bottom=0.3, top=0.6, wspace=0.2, hspace=0.4)
draw_ticks(ax, title="MultipleLocator(0.5)")
ax.xaxis.set_major_locator(ticker.MultipleLocator(0.5))
ax.xaxis.set_minor_locator(ticker.MultipleLocator(0.1))
ax.set_title('Multiple Locator')
plt.show()
輸出
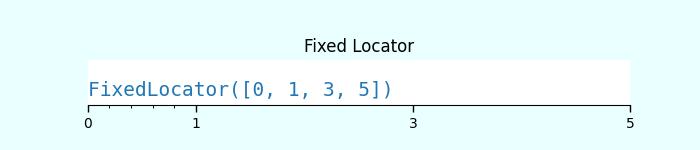
固定定位器
FixedLocator() 在指定固定的位置放置刻度。
示例
這是一個使用 FixedLocator() 類的示例。
# Fixed Locator
fig, ax = plt.subplots(1,1,figsize=(7,1.5), facecolor='#eaffff')
plt.subplots_adjust(bottom=0.3, top=0.6, wspace=0.2, hspace=0.4)
draw_ticks(ax, title="FixedLocator([0, 1, 3, 5])")
ax.xaxis.set_major_locator(ticker.FixedLocator([0, 1, 3, 5]))
ax.xaxis.set_minor_locator(ticker.FixedLocator(np.linspace(0.2, 0.8, 4)))
ax.set_title('Fixed Locator')
plt.show()
輸出
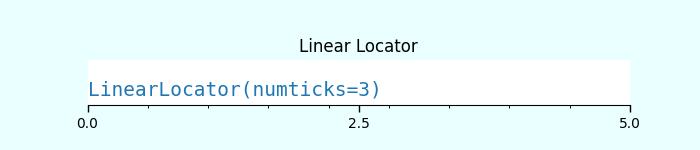
線性定位器
LinearLocator 在指定的最小值和最大值之間均勻地間隔刻度。
示例
這是一個將線性定位器應用於軸的主刻度和次刻度的示例。
# Linear Locator
fig, ax = plt.subplots(1,1,figsize=(7,1.5), facecolor='#eaffff')
plt.subplots_adjust(bottom=0.3, top=0.6, wspace=0.2, hspace=0.4)
draw_ticks(ax, title="LinearLocator(numticks=3)")
ax.xaxis.set_major_locator(ticker.LinearLocator(3))
ax.xaxis.set_minor_locator(ticker.LinearLocator(10))
ax.set_title('Linear Locator')
plt.show()
輸出
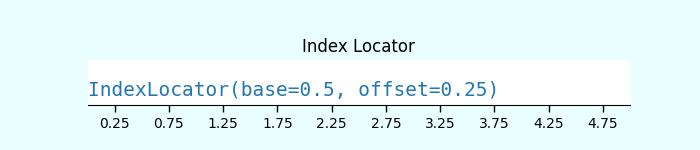
索引定位器
此定位器適用於索引圖,其中 x = range(len(y))。
示例
這是一個使用索引定位器 (ticker.IndexLocator() 類) 的示例。
# Index Locator
fig, ax = plt.subplots(1,1,figsize=(7,1.5), facecolor='#eaffff')
plt.subplots_adjust(bottom=0.3, top=0.6, wspace=0.2, hspace=0.4)
draw_ticks(ax, title="IndexLocator(base=0.5, offset=0.25)")
ax.plot([0]*5, color='white')
ax.xaxis.set_major_locator(ticker.IndexLocator(base=0.5, offset=0.25))
ax.set_title('Index Locator')
plt.show()
輸出
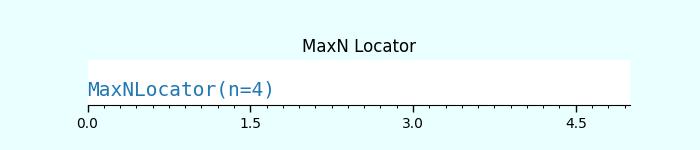
MaxN 定位器
MaxNLocator 找到最多一定數量的具有良好位置刻度的區間。示例
這是一個使用 MaxNLocator() 類對主刻度和次刻度進行操作的示例。
# MaxN Locator
fig, ax = plt.subplots(1,1,figsize=(7,1.5), facecolor='#eaffff')
plt.subplots_adjust(bottom=0.3, top=0.6, wspace=0.2, hspace=0.4)
draw_ticks(ax, title="MaxNLocator(n=4)")
ax.xaxis.set_major_locator(ticker.MaxNLocator(4))
ax.xaxis.set_minor_locator(ticker.MaxNLocator(40))
ax.set_title('MaxN Locator')
plt.show()
輸出
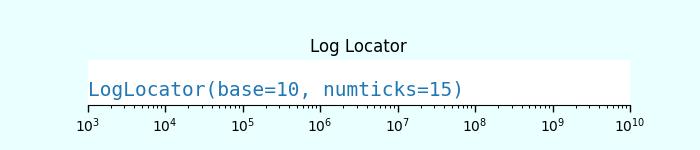
對數定位器
LogLocator 用於從 min 到 max 對數地間隔刻度。
示例
讓我們看看使用對數定位器的示例。它顯示了對數刻度上的次刻度標籤。
# Log Locator
fig, ax = plt.subplots(1,1,figsize=(7,1.5), facecolor='#eaffff')
plt.subplots_adjust(bottom=0.3, top=0.6, wspace=0.2, hspace=0.4)
draw_ticks(ax, title="LogLocator(base=10, numticks=15)")
ax.set_xlim(10**3, 10**10)
ax.set_xscale('log')
ax.xaxis.set_major_locator(ticker.LogLocator(base=10, numticks=15))
ax.set_title('Log Locator')
plt.show()
輸出