- Matplotlib 基礎
- Matplotlib - 首頁
- Matplotlib - 簡介
- Matplotlib - 與 Seaborn 的比較
- Matplotlib - 環境搭建
- Matplotlib - Anaconda 發行版
- Matplotlib - Jupyter Notebook
- Matplotlib - Pyplot API
- Matplotlib - 簡單繪圖
- Matplotlib - 儲存圖表
- Matplotlib - 標記
- Matplotlib - 圖表
- Matplotlib - 樣式
- Matplotlib - 圖例
- Matplotlib - 顏色
- Matplotlib - 顏色圖
- Matplotlib - 顏色圖歸一化
- Matplotlib - 選擇顏色圖
- Matplotlib - 顏色條
- Matplotlib - 文字
- Matplotlib - 文字屬性
- Matplotlib - 子圖示題
- Matplotlib - 圖片
- Matplotlib - 圖片蒙版
- Matplotlib - 註釋
- Matplotlib - 箭頭
- Matplotlib - 字型
- Matplotlib - 什麼是字型?
- 全域性設定字型屬性
- Matplotlib - 字型索引
- Matplotlib - 字型屬性
- Matplotlib - 比例尺
- Matplotlib - 線性與對數比例尺
- Matplotlib - 對稱對數和 Logit 比例尺
- Matplotlib - LaTeX
- Matplotlib - 什麼是 LaTeX?
- Matplotlib - LaTeX 用於數學表示式
- Matplotlib - 在註釋中使用 LaTeX 文字格式
- Matplotlib - PostScript
- 啟用註釋中的 LaTeX 渲染
- Matplotlib - 數學表示式
- Matplotlib - 動畫
- Matplotlib - 圖形元素
- Matplotlib - 使用 Cycler 進行樣式設定
- Matplotlib - 路徑
- Matplotlib - 路徑效果
- Matplotlib - 變換
- Matplotlib - 刻度和刻度標籤
- Matplotlib - 弧度刻度
- Matplotlib - 日期刻度
- Matplotlib - 刻度格式化器
- Matplotlib - 刻度定位器
- Matplotlib - 基本單位
- Matplotlib - 自動縮放
- Matplotlib - 反轉座標軸
- Matplotlib - 對數座標軸
- Matplotlib - Symlog
- Matplotlib - 單位處理
- Matplotlib - 帶單位的橢圓
- Matplotlib - 邊界
- Matplotlib - 座標軸範圍
- Matplotlib - 座標軸比例尺
- Matplotlib - 座標軸刻度
- Matplotlib - 座標軸格式化
- Matplotlib - Axes 類
- Matplotlib - 雙座標軸
- Matplotlib - Figure 類
- Matplotlib - 多圖
- Matplotlib - 網格
- Matplotlib - 面向物件介面
- Matplotlib - PyLab 模組
- Matplotlib - Subplots() 函式
- Matplotlib - Subplot2grid() 函式
- Matplotlib - 定點陣圖形元素
- Matplotlib - 手動等高線
- Matplotlib - 座標報告
- Matplotlib - AGG 濾鏡
- Matplotlib - 稜帶框
- Matplotlib - 填充螺旋線
- Matplotlib - findobj 演示
- Matplotlib - 超連結
- Matplotlib - 圖片縮圖
- Matplotlib - 使用關鍵字繪圖
- Matplotlib - 建立 Logo
- Matplotlib - 多頁 PDF
- Matplotlib - 多程序
- Matplotlib - 列印標準輸出
- Matplotlib - 複合路徑
- Matplotlib - Sankey 類
- Matplotlib - MRI 與 EEG
- Matplotlib - 樣式表
- Matplotlib - 背景顏色
- Matplotlib - Basemap
- Matplotlib 事件處理
- Matplotlib - 事件處理
- Matplotlib - 關閉事件
- Matplotlib - 滑鼠移動
- Matplotlib - 點選事件
- Matplotlib - 滾動事件
- Matplotlib - 按鍵事件
- Matplotlib - 選擇事件
- Matplotlib - 透視鏡
- Matplotlib - 路徑編輯器
- Matplotlib - 多邊形編輯器
- Matplotlib - 定時器
- Matplotlib - viewlims
- Matplotlib - 縮放視窗
- Matplotlib 小部件
- Matplotlib - 游標小部件
- Matplotlib - 帶註釋的游標
- Matplotlib - 按鈕小部件
- Matplotlib - 複選框
- Matplotlib - 套索選擇器
- Matplotlib - 選單小部件
- Matplotlib - 滑鼠游標
- Matplotlib - 多游標
- Matplotlib - 多邊形選擇器
- Matplotlib - 單選按鈕
- Matplotlib - RangeSlider
- Matplotlib - 矩形選擇器
- Matplotlib - 橢圓選擇器
- Matplotlib - 滑塊小部件
- Matplotlib - Span Selector
- Matplotlib - 文字框
- Matplotlib 繪圖
- Matplotlib - 條形圖
- Matplotlib - 直方圖
- Matplotlib - 餅圖
- Matplotlib - 散點圖
- Matplotlib - 箱線圖
- Matplotlib - 小提琴圖
- Matplotlib - 等高線圖
- Matplotlib - 3D 繪圖
- Matplotlib - 3D 等高線
- Matplotlib - 3D 線框圖
- Matplotlib - 3D 表面圖
- Matplotlib - Quiver 圖
- Matplotlib 有用資源
- Matplotlib - 快速指南
- Matplotlib - 有用資源
- Matplotlib - 討論
Matplotlib - 餅圖
餅圖只能顯示一個數據系列。餅圖顯示一個數據系列中各項(稱為扇區)的大小,與各項之和成比例。餅圖中的資料點顯示為整個餅圖的百分比。
Matplotlib API 有一個pie()函式,它可以生成一個餅圖,表示陣列中的資料。每個扇區的比例面積由x/sum(x)給出。如果sum(x)< 1,則x的值直接給出比例面積,並且陣列不會被標準化。生成的餅圖將有一個大小為1 - sum(x)的空扇區。
如果圖形和座標軸是正方形,或者座標軸縱橫比相等,則餅圖看起來最好。
引數
下表列出了餅圖的引數:
| x | 類陣列。扇區大小。 |
| labels | 列表。一系列字串,為每個扇區提供標籤。 |
| Colors | 一系列 matplotlib 顏色引數,餅圖將迴圈使用這些引數。如果為 None,則將使用當前活動迴圈中的顏色。 |
| Autopct | 字串,用於使用數值標記扇區。標籤將放置在扇區內。格式字串將為 fmt%pct。 |
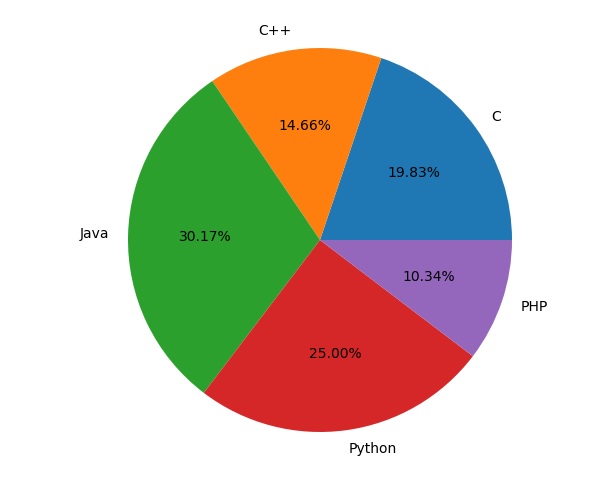
以下程式碼使用 pie() 函式顯示註冊各種計算機語言課程的學生列表的餅圖。比例百分比在各個扇區內顯示,藉助於設定為 %1.2f% 的autopct引數。
from matplotlib import pyplot as plt
import numpy as np
fig = plt.figure()
ax = fig.add_axes([0,0,1,1])
ax.axis('equal')
langs = ['C', 'C++', 'Java', 'Python', 'PHP']
students = [23,17,35,29,12]
ax.pie(students, labels = langs,autopct='%1.2f%%')
plt.show()
廣告