- Matplotlib 基礎
- Matplotlib - 首頁
- Matplotlib - 簡介
- Matplotlib - 與 Seaborn 的比較
- Matplotlib - 環境設定
- Matplotlib - Anaconda 發行版
- Matplotlib - Jupyter Notebook
- Matplotlib - Pyplot API
- Matplotlib - 簡單繪圖
- Matplotlib - 儲存圖形
- Matplotlib - 標記
- Matplotlib - 圖形
- Matplotlib - 樣式
- Matplotlib - 圖例
- Matplotlib - 顏色
- Matplotlib - 色圖
- Matplotlib - 色圖歸一化
- Matplotlib - 選擇色圖
- Matplotlib - 色標
- Matplotlib - 文字
- Matplotlib - 文字屬性
- Matplotlib - 子圖示題
- Matplotlib - 影像
- Matplotlib - 影像蒙版
- Matplotlib - 註釋
- Matplotlib - 箭頭
- Matplotlib - 字型
- Matplotlib - 什麼是字型?
- 全域性設定字型屬性
- Matplotlib - 字型索引
- Matplotlib - 字型屬性
- Matplotlib - 刻度
- Matplotlib - 線性和對數刻度
- Matplotlib - 對稱對數和 Logit 刻度
- Matplotlib - LaTeX
- Matplotlib - 什麼是 LaTeX?
- Matplotlib - LaTeX 用於數學表示式
- Matplotlib - LaTeX 在註釋中的文字格式
- Matplotlib - PostScript
- 在註釋中啟用 LaTeX 渲染
- Matplotlib - 數學表示式
- Matplotlib - 動畫
- Matplotlib - 藝術家
- Matplotlib - 使用 Cycler 進行樣式設定
- Matplotlib - 路徑
- Matplotlib - 路徑效果
- Matplotlib - 變換
- Matplotlib - 刻度和刻度標籤
- Matplotlib - 弧度刻度
- Matplotlib - 日期刻度
- Matplotlib - 刻度格式化器
- Matplotlib - 刻度定位器
- Matplotlib - 基本單位
- Matplotlib - 自動縮放
- Matplotlib - 反轉軸
- Matplotlib - 對數軸
- Matplotlib - Symlog
- Matplotlib - 單位處理
- Matplotlib - 帶單位的橢圓
- Matplotlib - 脊柱
- Matplotlib - 軸範圍
- Matplotlib - 軸刻度
- Matplotlib - 軸刻度
- Matplotlib - 格式化軸
- Matplotlib - Axes 類
- Matplotlib - 雙軸
- Matplotlib - Figure 類
- Matplotlib - 多圖
- Matplotlib - 網格
- Matplotlib - 面向物件介面
- Matplotlib - PyLab 模組
- Matplotlib - Subplots() 函式
- Matplotlib - Subplot2grid() 函式
- Matplotlib - 固定藝術家
- Matplotlib - 手動等值線
- Matplotlib - 座標報告
- Matplotlib - AGG 過濾器
- Matplotlib - 飄帶框
- Matplotlib - 填充螺旋
- Matplotlib - Findobj 演示
- Matplotlib - 超連結
- Matplotlib - 影像縮圖
- Matplotlib - 使用關鍵字繪圖
- Matplotlib - 建立 Logo
- Matplotlib - 多頁 PDF
- Matplotlib - 多程序
- Matplotlib - 列印標準輸出
- Matplotlib - 複合路徑
- Matplotlib - Sankey 類
- Matplotlib - MRI 與 EEG
- Matplotlib - 樣式表
- Matplotlib - 背景顏色
- Matplotlib - Basemap
- Matplotlib 事件處理
- Matplotlib - 事件處理
- Matplotlib - 關閉事件
- Matplotlib - 滑鼠移動
- Matplotlib - 點選事件
- Matplotlib - 滾動事件
- Matplotlib - 按鍵事件
- Matplotlib - 選擇事件
- Matplotlib - 放大鏡
- Matplotlib - 路徑編輯器
- Matplotlib - 多邊形編輯器
- Matplotlib - 定時器
- Matplotlib - Viewlims
- Matplotlib - 縮放視窗
- Matplotlib 小部件
- Matplotlib - 遊標小部件
- Matplotlib - 帶註釋的遊標
- Matplotlib - 按鈕小部件
- Matplotlib - 複選框
- Matplotlib - 套索選擇器
- Matplotlib - 選單小部件
- Matplotlib - 滑鼠遊標
- Matplotlib - 多遊標
- Matplotlib - 多邊形選擇器
- Matplotlib - 單選按鈕
- Matplotlib - 範圍滑塊
- Matplotlib - 矩形選擇器
- Matplotlib - 橢圓選擇器
- Matplotlib - 滑塊小部件
- Matplotlib - 跨度選擇器
- Matplotlib - 文字框
- Matplotlib 繪圖
- Matplotlib - 條形圖
- Matplotlib - 直方圖
- Matplotlib - 餅圖
- Matplotlib - 散點圖
- Matplotlib - 箱線圖
- Matplotlib - 小提琴圖
- Matplotlib - 等值線圖
- Matplotlib - 3D 繪圖
- Matplotlib - 3D 等值線
- Matplotlib - 3D 線框圖
- Matplotlib - 3D 曲面圖
- Matplotlib - Quiver 圖
- Matplotlib 有用資源
- Matplotlib - 快速指南
- Matplotlib - 有用資源
- Matplotlib - 討論
Matplotlib - 脊柱
什麼是脊柱?
在 Matplotlib 庫中,脊柱指的是圍繞資料區域的繪圖邊框或邊緣。這些脊柱包含繪圖的邊界,定義了顯示資料點的區域。預設情況下,繪圖有四個脊柱,例如頂部、底部、左側和右側。
在 Matplotlib 中操作脊柱提供了設計繪圖視覺方面的靈活性,允許對資料的呈現進行更量身定製和美觀的呈現。
脊柱的關鍵特徵
以下是脊柱的特徵。
繪圖的邊界 - 脊柱構成繪圖區域的邊界,包圍了資料視覺化的區域。
可配置屬性 - 每個脊柱(頂部、底部、左側和右側)都可以單獨自定義,允許調整其外觀、顏色、粗細和可見性。
可見性控制 - 可以使脊柱可見或隱藏以修改繪圖的外觀。
脊柱的用途
繪圖自定義 - 脊柱允許自定義繪圖的外觀,可以調整繪圖的邊界和樣式。
美觀和視覺化 - 自定義脊柱可以增強繪圖的美觀性,並吸引人們注意感興趣的特定區域。
脊柱型別
現在讓我們詳細瞭解繪圖中每個脊柱。
頂部脊柱
頂部脊柱指的是繪圖區域頂部的水平線,對應於 y 軸的上邊界。它是構成繪圖周圍邊框的四個脊柱(頂部、底部、左側和右側)之一。
頂部脊柱的特徵
邊界線 - 頂部脊柱表示沿 y 軸的繪圖區域的上邊界。
預設可見性 - 預設情況下,頂部脊柱在 Matplotlib 繪圖中可見。
自定義 - 與其他脊柱類似,頂部脊柱可以在其可見性、顏色、線型和線寬方面進行自定義。
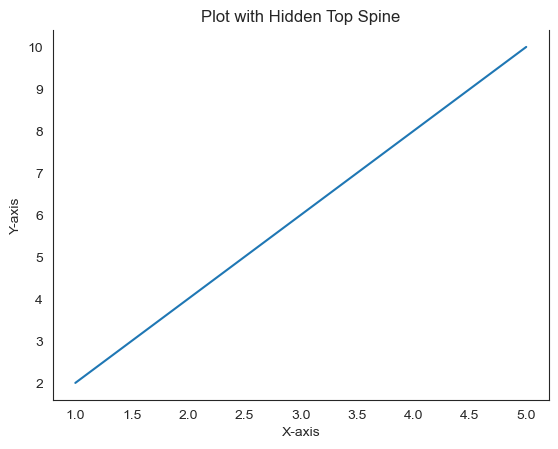
示例
在此示例中,ax.spines['top'].set_visible(False) 透過移除沿 y 軸的繪圖區域的上邊界來隱藏頂部脊柱。
import matplotlib.pyplot as plt

# Creating a simple plot
x = [1, 2, 3, 4, 5]
y = [2, 4, 6, 8, 10]
plt.plot(x, y)

# Accessing and modifying the top spine
ax = plt.gca()  # Get the current axes
ax.spines['top'].set_visible(False)  # Hide the top spine
plt.xlabel('X-axis')
plt.ylabel('Y-axis')
plt.title('Plot with Hidden Top Spine')
plt.show()
輸出
修改頂部脊柱的用例
美觀控制 - 自定義頂部脊柱的可見性、顏色或樣式可以改善外觀或匹配特定設計要求。
調整繪圖邊界 - 當繪圖不需要上邊界或建立特定視覺效果時,隱藏頂部脊柱可能很有用。
底部脊柱
在 Matplotlib 中,底部脊柱指的是構成繪圖區域底部邊框的水平線,對應於 x 軸。
底部脊柱的特徵
與 x 軸關聯 - 底部脊柱表示沿 x 軸的繪圖邊界,定義了繪圖區域的下邊界。
自定義 - 與其他脊柱類似,底部脊柱可以在其可見性、顏色、線型、粗細和位置方面進行自定義。
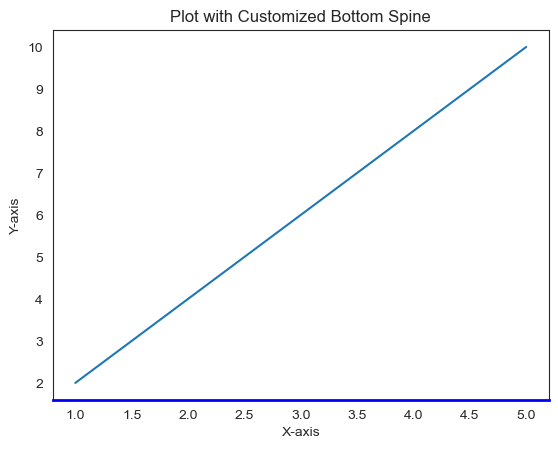
自定義底部脊柱的示例
在此示例中,使用ax.spines['bottom'].set_color('blue') 將底部脊柱的顏色更改為藍色,ax.spines['bottom'].set_linewidth(2) 將底部脊柱的粗細設定為 2,並且ax.spines['bottom'].set_visible(True) 確保底部脊柱可見(如果它被隱藏了)。
import matplotlib.pyplot as plt

# Creating a simple plot
x = [1, 2, 3, 4, 5]
y = [2, 4, 6, 8, 10]
plt.plot(x, y)

# Accessing and customizing the bottom spine
ax = plt.gca()  # Get the current axes
ax.spines['bottom'].set_color('blue')  # Change the color of the bottom spine to blue
ax.spines['bottom'].set_linewidth(2)  # Set the thickness of the bottom spine to 2
ax.spines['bottom'].set_visible(True)  # Make the bottom spine visible (if previously hidden)
plt.xlabel('X-axis')
plt.ylabel('Y-axis')
plt.title('Plot with Customized Bottom Spine')
plt.show()
輸出
底部脊柱自定義的用例
強調軸 - 透過自定義底部脊柱可以吸引人們注意 x 軸並增強繪圖的美觀性。
突出顯示繪圖邊界 - 透過調整底部脊柱的外觀可以幫助描繪繪圖區域並提高其清晰度。
左側脊柱
在 Matplotlib 中,左側脊柱指的是構成繪圖區域左側邊框的垂直線,對應於 y 軸。
左側脊柱的特徵
與 y 軸關聯 - 左側脊柱表示沿 y 軸的繪圖邊界,定義了繪圖區域的左邊界。
自定義 - 左側脊柱的自定義類似於其他脊柱,可以透過顏色、可見性、邊框寬度等進行自定義。
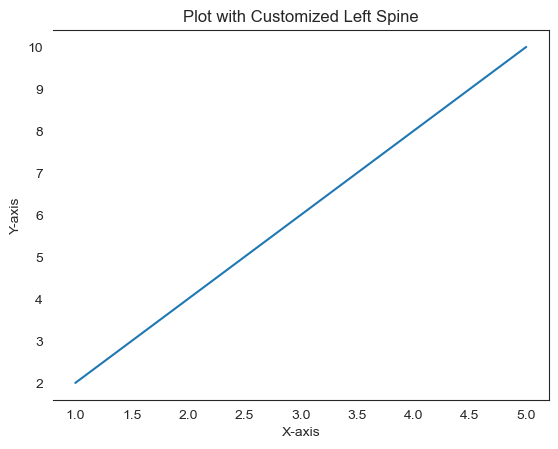
自定義左側脊柱的示例
在此示例中,ax.spines['left'].set_color('green') 將左側脊柱的顏色更改為綠色,ax.spines['left'].set_linewidth(2) 將左側脊柱的粗細設定為 2,並且ax.spines['left'].set_visible(False) 確保左側脊柱不可見(如果它可見)。
import matplotlib.pyplot as plt

# Creating a simple plot
x = [1, 2, 3, 4, 5]
y = [2, 4, 6, 8, 10]
plt.plot(x, y)

# Accessing and customizing the left spine
ax = plt.gca()  # Get the current axes
ax.spines['left'].set_color('green')  # Change the color of the left spine to green
ax.spines['left'].set_linewidth(2)  # Set the thickness of the left spine to 2
ax.spines['left'].set_visible(False)  # Make the left spine invisible (if previously visible)
plt.xlabel('X-axis')
plt.ylabel('Y-axis')
plt.title('Plot with Customized Left Spine')
plt.show()
輸出
右側脊柱
在 Matplotlib 中,右側脊柱表示構成繪圖區域右側邊框的垂直線,對應於右側的 y 軸。
右側脊柱的特徵
與 y 軸關聯 - 右側脊柱定義了沿 y 軸的繪圖右側邊界,表示繪圖右側的 y 軸。
自定義 - 與其他脊柱類似,右側脊柱可以在其可見性、顏色、線型、粗細和位置方面進行自定義。
自定義右側脊柱的示例
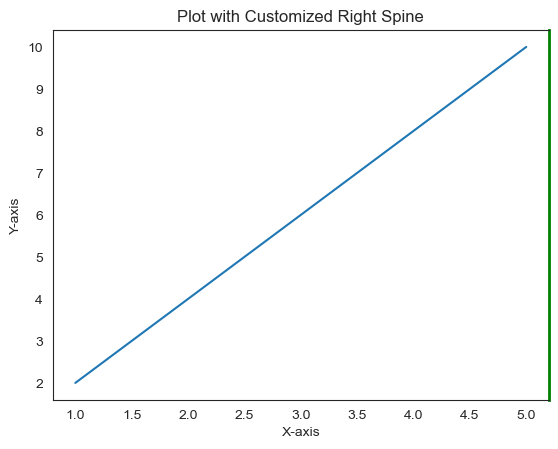
在此示例中,我們使用ax.spines['right'] 來自定義繪圖的右側脊柱。
import matplotlib.pyplot as plt

# Creating a simple plot
x = [1, 2, 3, 4, 5]
y = [2, 4, 6, 8, 10]
plt.plot(x, y)

# Accessing and customizing the right spine
ax = plt.gca()  # Get the current axes
ax.spines['right'].set_color('green')  # Change the color of the right spine to green
ax.spines['right'].set_linewidth(2)  # Set the thickness of the right spine to 2
ax.spines['right'].set_visible(True)  # Make the right spine visible (if previously hidden)
plt.xlabel('X-axis')
plt.ylabel('Y-axis')
plt.title('Plot with Customized Right Spine')
plt.show()
輸出
自定義 Matplotlib 圖形的脊柱
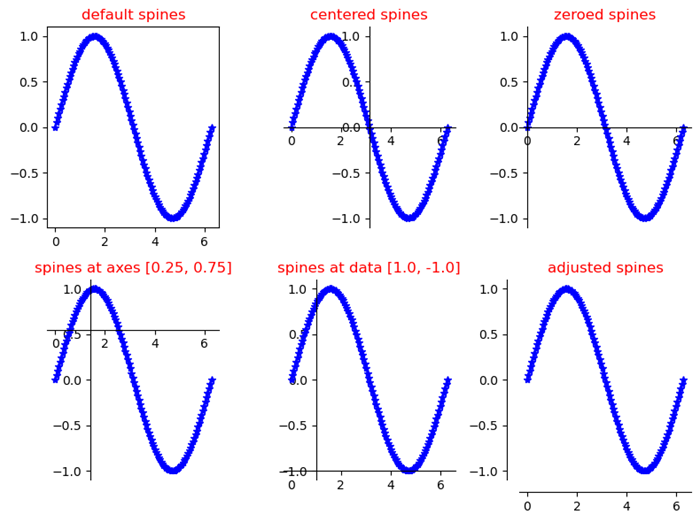
在此示例中,我們建立了六個圖形以檢視並自定義它們的脊柱。
示例
#First import the required libraries for the workbook.
import numpy as np
import matplotlib.pyplot as plt

#draw graph for sines
theta = np.linspace(0, 2*np.pi, 128)
y = np.sin(theta)
fig = plt.figure(figsize=(8,6))

#Define the axes with default spines
ax1 = fig.add_subplot(2, 3, 1)
ax1.plot(theta, np.sin(theta), 'b-*')
ax1.set_title('default spines')

#Define the function to plot the graph
def plot_graph(axs, title, lposition, bposition):
   ax = fig.add_subplot(axs)
   ax.plot(theta, y, 'b-*')
   ax.set_title(title)
   ax.spines['left'].set_position(lposition)
   ax.spines['right'].set_visible(False)
   ax.spines['bottom'].set_position(bposition)
   ax.spines['top'].set_visible(False)
   ax.xaxis.set_ticks_position('bottom')
   ax.yaxis.set_ticks_position('left')

#plot 3 graphs
plot_graph(232, 'centered spines', 'center', 'center')
plot_graph(233, 'zeroed spines', 'zero', 'zero')
plot_graph(234, 'spines at axes [0.25, 0.75]', ('axes', 0.25),('axes', 0.75))
plot_graph(235, 'spines at data [1.0, -1.0]', ('data', 1.0),('data', -1.0))
plot_graph(236, 'adjusted spines', ('outward', 10), ('outward', 10))

#fit the plot in the grid and display.
plt.tight_layout()
plt.show()
輸出