- Matplotlib 基礎
- Matplotlib - 首頁
- Matplotlib - 簡介
- Matplotlib - 與 Seaborn 的比較
- Matplotlib - 環境搭建
- Matplotlib - Anaconda 發行版
- Matplotlib - Jupyter Notebook
- Matplotlib - Pyplot API
- Matplotlib - 簡單繪圖
- Matplotlib - 儲存圖片
- Matplotlib - 標記
- Matplotlib - 圖表
- Matplotlib - 樣式
- Matplotlib - 圖例
- Matplotlib - 顏色
- Matplotlib - 顏色圖
- Matplotlib - 顏色圖歸一化
- Matplotlib - 選擇顏色圖
- Matplotlib - 顏色條
- Matplotlib - 文字
- Matplotlib - 文字屬性
- Matplotlib - 子圖示題
- Matplotlib - 圖片
- Matplotlib - 圖片蒙版
- Matplotlib - 註釋
- Matplotlib - 箭頭
- Matplotlib - 字型
- Matplotlib - 什麼是字型?
- 全域性設定字型屬性
- Matplotlib - 字型索引
- Matplotlib - 字型屬性
- Matplotlib - 刻度
- Matplotlib - 線性與對數刻度
- Matplotlib - 對稱對數和 Logit 刻度
- Matplotlib - LaTeX
- Matplotlib - 什麼是 LaTeX?
- Matplotlib - LaTeX 用於數學表示式
- Matplotlib - 在註釋中使用 LaTeX 文字格式
- Matplotlib - PostScript
- 啟用註釋中的 LaTeX 渲染
- Matplotlib - 數學表示式
- Matplotlib - 動畫
- Matplotlib - 圖形元素
- Matplotlib - 使用 Cycler 進行樣式設定
- Matplotlib - 路徑
- Matplotlib - 路徑效果
- Matplotlib - 變換
- Matplotlib - 刻度線和刻度標籤
- Matplotlib - 弧度刻度
- Matplotlib - 日期刻度
- Matplotlib - 刻度格式化器
- Matplotlib - 刻度定位器
- Matplotlib - 基本單位
- Matplotlib - 自動縮放
- Matplotlib - 反轉座標軸
- Matplotlib - 對數座標軸
- Matplotlib - 對數線性刻度
- Matplotlib - 單位處理
- Matplotlib - 帶單位的橢圓
- Matplotlib - 脊柱
- Matplotlib - 座標軸範圍
- Matplotlib - 座標軸刻度
- Matplotlib - 座標軸刻度線
- Matplotlib - 格式化座標軸
- Matplotlib - Axes 類
- Matplotlib - 雙座標軸
- Matplotlib - Figure 類
- Matplotlib - 多圖
- Matplotlib - 網格
- Matplotlib - 面向物件介面
- Matplotlib - PyLab 模組
- Matplotlib - subplots() 函式
- Matplotlib - subplot2grid() 函式
- Matplotlib - 定點陣圖形元素
- Matplotlib - 手動等高線
- Matplotlib - 座標報告
- Matplotlib - AGG 過濾器
- Matplotlib - 矩形帶
- Matplotlib - 填充螺旋線
- Matplotlib - findobj 演示
- Matplotlib - 超連結
- Matplotlib - 圖片縮圖
- Matplotlib - 使用關鍵字繪圖
- Matplotlib - 建立 Logo
- Matplotlib - 多頁 PDF
- Matplotlib - 多程序
- Matplotlib - 列印標準輸出
- Matplotlib - 複合路徑
- Matplotlib - Sankey 類
- Matplotlib - MRI 與 EEG
- Matplotlib - 樣式表
- Matplotlib - 背景顏色
- Matplotlib - Basemap
- Matplotlib 事件處理
- Matplotlib - 事件處理
- Matplotlib - 關閉事件
- Matplotlib - 滑鼠移動
- Matplotlib - 點選事件
- Matplotlib - 滾動事件
- Matplotlib - 按鍵事件
- Matplotlib - 選擇事件
- Matplotlib - 透視鏡
- Matplotlib - 路徑編輯器
- Matplotlib - 多邊形編輯器
- Matplotlib - 定時器
- Matplotlib - viewlims
- Matplotlib - 縮放視窗
- Matplotlib 小部件
- Matplotlib - 游標小部件
- Matplotlib - 帶註釋的游標
- Matplotlib - 按鈕小部件
- Matplotlib - 複選框
- Matplotlib - 套索選擇器
- Matplotlib - 選單小部件
- Matplotlib - 滑鼠游標
- Matplotlib - 多游標
- Matplotlib - 多邊形選擇器
- Matplotlib - 單選按鈕
- Matplotlib - RangeSlider
- Matplotlib - 矩形選擇器
- Matplotlib - 橢圓選擇器
- Matplotlib - 滑塊小部件
- Matplotlib - Span Selector
- Matplotlib - 文字框
- Matplotlib 繪圖
- Matplotlib - 條形圖
- Matplotlib - 直方圖
- Matplotlib - 餅圖
- Matplotlib - 散點圖
- Matplotlib - 箱線圖
- Matplotlib - 小提琴圖
- Matplotlib - 等高線圖
- Matplotlib - 3D 繪圖
- Matplotlib - 3D 等高線
- Matplotlib - 3D 線框圖
- Matplotlib - 3D 曲面圖
- Matplotlib - 矢羽圖
- Matplotlib 有用資源
- Matplotlib - 快速指南
- Matplotlib - 有用資源
- Matplotlib - 討論
Matplotlib - 對數線性刻度
什麼是對數線性刻度?
在 Matplotlib 中,對數線性刻度 (symlog) 結合了線性刻度和對數刻度,提供了一種繪製包含正值和負值資料的方法,同時適應各種數量級。
對數線性刻度的特點
以下是對數線性刻度的特點。讓我們逐一詳細瞭解。
零點附近線性
在 Matplotlib 庫的對數線性刻度中,零點附近線性指的是刻度在零點附近的行為。對數線性刻度結合了線性刻度和對數刻度,尤其是在零點附近,以便更細緻地表示資料。
零點附近的線性行為
接近零 - 對於接近零的值(即零點周圍的某個範圍內),對數線性刻度的行為是線性的,類似於線性刻度。
線性閾值 (linthresh) - linthresh 引數定義了刻度線性行為的零點周圍範圍。此閾值內的值以線性方式表示。
線性區域 - 在指定的零點周圍閾值內,對數線性刻度的行為類似於典型的線性刻度,保留了資料值與其在圖上表示之間的直接關係。
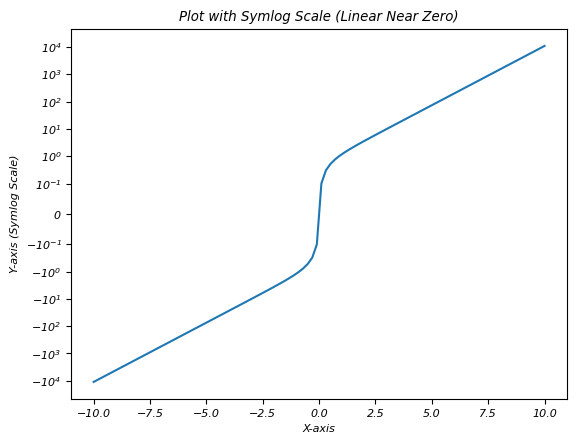
示例
在這個例子中,我們將 linthresh 引數設定為 0.1,使得零點周圍的範圍(在本例中為 -0.1 到 0.1)表現為線性。此範圍內的值在圖上以線性方式表示,從而可以更集中、更精確地顯示接近零的資料,同時以對數方式適應遠離零的較大值。
import matplotlib.pyplot as plt
import numpy as np
# Sample data with positive and negative values
x = np.linspace(-10, 10, 100)
y = np.sinh(x)  # Hyperbolic sine function for demonstration
# Creating a plot with symlog scale on y-axis
plt.plot(x, y)
plt.yscale('symlog', linthresh=0.1)  # Set y-axis to symlog scale with a linear threshold of 0.1
plt.xlabel('X-axis')
plt.ylabel('Y-axis (Symlog Scale)')
plt.title('Plot with Symlog Scale (Linear Near Zero)')
plt.show()
輸出
零點附近線性的用例
關注零點附近的小變化 - 允許更好地表示零點附近的小變化或差異,而不會丟失關於較大值的資訊。
處理以零為中心的模式的資料 - 對於以零為中心出現模式或變化的資料集非常有用。
對稱對數刻度
對稱對數刻度在 Matplotlib 中通常稱為 symlog 刻度,這是一種結合線性刻度和對數刻度來對稱表示零點周圍資料的方法。當處理包含跨越正負範圍的值且需要在各種值範圍內進行細緻表示的資料集時,此刻度特別有用。
對稱對數刻度的特點
對稱行為 - 對稱對數刻度保持圍繞零的對稱性,適應正值和負值。
零點附近線性區域 - 接近零點(零點周圍的某個範圍內),刻度線性執行,保留了值與其在圖上表示之間的直接比例關係。
遠離零的對數刻度 - 當值遠離零點(正負值)時,刻度轉換為對數刻度,允許以對數方式表示較大的絕對值。
線性閾值 (linthresh) - linthresh 引數定義了刻度線性行為的零點周圍範圍。
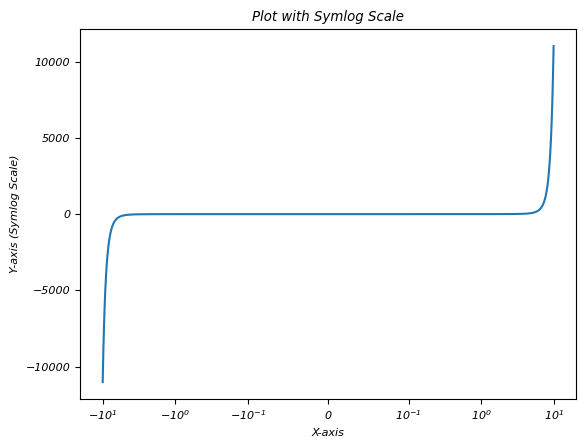
示例
在這個例子中,linthresh 為 0.1 的對稱對數刻度指定了範圍在 -0.1 到 0.1(零點附近)的值在 x 軸上以線性方式表示。
import matplotlib.pyplot as plt
import numpy as np
# Sample data with positive and negative values
x = np.linspace(-10, 10, 100)
y = np.sinh(x)  # Hyperbolic sine function for demonstration
# Creating a plot with symlog scale on y-axis
plt.plot(x, y)
plt.xscale('symlog', linthresh=0.1)  # Set x-axis to symlog scale with a linear threshold of 0.1
plt.xlabel('X-axis')
plt.ylabel('Y-axis (Symlog Scale)')
plt.title('Plot with Symlog Scale')
plt.show()
輸出
用例
處理同時包含正值和負值的資料 - 對於跨越正負範圍的資料集非常有用。
集中的視覺化 - 這允許關注零點附近的小變化,同時以對數方式適應遠離零的較大值。
遠離零的對數刻度
遠離零的對數刻度指的是對數刻度在繪圖中的行為,尤其是在 Matplotlib 的對數線性刻度中。
以下是遠離零的對數刻度的特點。
接近零 - 接近零點(由 linthresh 引數定義的零點周圍的指定範圍),刻度呈線性行為,保留了繪製的值與其在圖上表示之間的直接關係。
遠離零 - 當值遠離零點(正負值)時,刻度轉換為對數刻度。
對數行為 - 刻度以對數方式表示較大的絕對值,使用基數的值(例如,通常為 10 或 e)來壓縮這些較大值的範圍。
值的壓縮 - 由於對數刻度,遠離零的較大絕對值在圖上被壓縮,這使得更有效地視覺化寬範圍的值變得更容易。
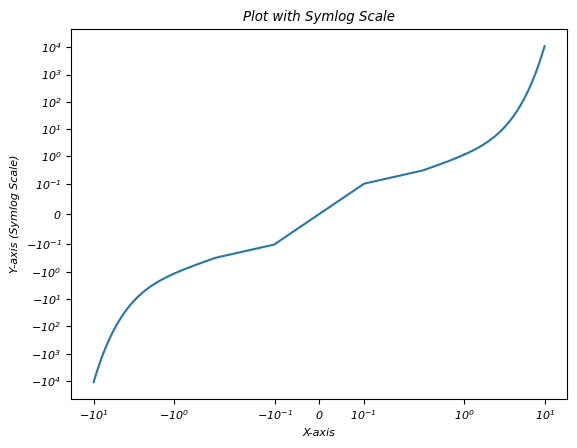
示例
在這個例子中,我們將 xscale 和 yscale 的 linthresh 引數分別設定為 0.2 和 0.1。
import matplotlib.pyplot as plt
import numpy as np
# Sample data with positive and negative values
x = np.linspace(-10, 10, 100)
y = np.sinh(x)  # Hyperbolic sine function for demonstration
# Creating a plot with symlog scale on y-axis
plt.plot(x, y)
plt.xscale('symlog', linthresh=0.2)  # Set x-axis to symlog scale with a linear threshold of 0.2
plt.yscale('symlog', linthresh=0.1)  # Set x-axis to symlog scale with a linear threshold of 0.1
plt.xlabel('X-axis')
plt.ylabel('Y-axis (Symlog Scale)')
plt.title('Plot with Symlog Scale')
plt.show()
輸出