- Matplotlib 基礎
- Matplotlib - 首頁
- Matplotlib - 簡介
- Matplotlib - 與 Seaborn 的比較
- Matplotlib - 環境設定
- Matplotlib - Anaconda 發行版
- Matplotlib - Jupyter Notebook
- Matplotlib - Pyplot API
- Matplotlib - 簡單繪圖
- Matplotlib - 儲存圖形
- Matplotlib - 標記
- Matplotlib - 圖形
- Matplotlib - 樣式
- Matplotlib - 圖例
- Matplotlib - 顏色
- Matplotlib - 顏色對映
- Matplotlib - 顏色對映歸一化
- Matplotlib - 選擇顏色對映
- Matplotlib - 顏色條
- Matplotlib - 文字
- Matplotlib - 文字屬性
- Matplotlib - 子圖示題
- Matplotlib - 影像
- Matplotlib - 影像蒙版
- Matplotlib - 註釋
- Matplotlib - 箭頭
- Matplotlib - 字型
- Matplotlib - 什麼是字型?
- 全域性設定字型屬性
- Matplotlib - 字型索引
- Matplotlib - 字型屬性
- Matplotlib - 刻度
- Matplotlib - 線性與對數刻度
- Matplotlib - 對稱對數與 Logit 刻度
- Matplotlib - LaTeX
- Matplotlib - 什麼是 LaTeX?
- Matplotlib - LaTeX 用於數學表示式
- Matplotlib - LaTeX 在註釋中的文字格式化
- Matplotlib - PostScript
- 在註釋中啟用 LaTeX 渲染
- Matplotlib - 數學表示式
- Matplotlib - 動畫
- Matplotlib - 圖形物件
- Matplotlib - 使用 Cycler 進行樣式設定
- Matplotlib - 路徑
- Matplotlib - 路徑效果
- Matplotlib - 變換
- Matplotlib - 刻度和刻度標籤
- Matplotlib - 弧度刻度
- Matplotlib - 日期刻度
- Matplotlib - 刻度格式化器
- Matplotlib - 刻度定位器
- Matplotlib - 基本單位
- Matplotlib - 自動縮放
- Matplotlib - 反轉軸
- Matplotlib - 對數軸
- Matplotlib - Symlog
- Matplotlib - 單位處理
- Matplotlib - 帶單位的橢圓
- Matplotlib - 脊柱
- Matplotlib - 軸範圍
- Matplotlib - 軸刻度
- Matplotlib - 軸刻度
- Matplotlib - 格式化軸
- Matplotlib - Axes 類
- Matplotlib - 雙軸
- Matplotlib - Figure 類
- Matplotlib - 多圖
- Matplotlib - 網格
- Matplotlib - 面向物件介面
- Matplotlib - PyLab 模組
- Matplotlib - Subplots() 函式
- Matplotlib - Subplot2grid() 函式
- Matplotlib - 錨定圖形物件
- Matplotlib - 手動等值線
- Matplotlib - 座標報告
- Matplotlib - AGG 過濾器
- Matplotlib - 帶狀框
- Matplotlib - 填充螺旋線
- Matplotlib - Findobj 演示
- Matplotlib - 超連結
- Matplotlib - 影像縮圖
- Matplotlib - 使用關鍵字繪圖
- Matplotlib - 建立 Logo
- Matplotlib - 多頁 PDF
- Matplotlib - 多程序
- Matplotlib - 列印標準輸出
- Matplotlib - 複合路徑
- Matplotlib - Sankey 類
- Matplotlib - MRI 與 EEG
- Matplotlib - 樣式表
- Matplotlib - 背景顏色
- Matplotlib - Basemap
- Matplotlib 事件處理
- Matplotlib - 事件處理
- Matplotlib - 關閉事件
- Matplotlib - 滑鼠移動
- Matplotlib - 點選事件
- Matplotlib - 滾動事件
- Matplotlib - 按鍵事件
- Matplotlib - 選擇事件
- Matplotlib - 觀察鏡
- Matplotlib - 路徑編輯器
- Matplotlib - 多邊形編輯器
- Matplotlib - 定時器
- Matplotlib - Viewlims
- Matplotlib - 縮放視窗
- Matplotlib 小部件
- Matplotlib - 游標小部件
- Matplotlib - 帶註釋的游標
- Matplotlib - 按鈕小部件
- Matplotlib - 複選框
- Matplotlib - 套索選擇器
- Matplotlib - 選單小部件
- Matplotlib - 滑鼠游標
- Matplotlib - 多游標
- Matplotlib - 多邊形選擇器
- Matplotlib - 單選按鈕
- Matplotlib - 範圍滑塊
- Matplotlib - 矩形選擇器
- Matplotlib - 橢圓選擇器
- Matplotlib - 滑塊小部件
- Matplotlib - 跨度選擇器
- Matplotlib - 文字框
- Matplotlib 繪圖
- Matplotlib - 條形圖
- Matplotlib - 直方圖
- Matplotlib - 餅圖
- Matplotlib - 散點圖
- Matplotlib - 箱線圖
- Matplotlib - 小提琴圖
- Matplotlib - 等值線圖
- Matplotlib - 3D 繪圖
- Matplotlib - 3D 等值線
- Matplotlib - 3D 線框圖
- Matplotlib - 3D 曲面圖
- Matplotlib - Quiver 圖
- Matplotlib 有用資源
- Matplotlib - 快速指南
- Matplotlib - 有用資源
- Matplotlib - 討論
Matplotlib - 矩形選擇器
介紹
Matplotlib 庫沒有內建的RectangleSelector 小部件。但是,我們可以使用 Matplotlib 的事件處理機制來實現類似的功能。RectangleSelector 通常允許使用者在繪圖上繪製一個矩形,並且選擇矩形內的所有資料點。
矩形選擇器的關鍵概念
以下是矩形選擇器的關鍵概念。
- 使用者互動 - RectangleSelector 提供了一種方法,允許使用者透過單擊和拖動滑鼠在繪圖上互動式地繪製矩形。
- 資料選擇 - RectangleSelector 的主要目的是選擇繪製的矩形內的資料點的子集。這對於資料探索和分析等任務很有價值。
- 事件處理 - 實現涉及處理滑鼠事件(例如按鈕按下和釋放)以跟蹤繪製矩形的座標。
用例
以下是 RectangularSelector 小部件的用例。
- 資料子集 - RectangleSelector 可用於選擇和分析較大資料集中的資料點的子集。
- 資料探索 - 使用者可以互動式地探索繪圖的不同區域,以瞭解特定區域的模式或趨勢。
- 互動式儀表板 - 對於互動式儀表板或應用程式,可以整合 RectangleSelector 以允許使用者動態選擇和分析資料。
- 感興趣區域 (ROI) 選擇 - 在科學或工程應用中,使用者可能希望定義感興趣區域以進行進一步調查。
實施步驟
要在 Matplotlib 中實現自定義矩形選擇器,我們通常可以遵循以下步驟。
- 啟用滑鼠事件 - Matplotlib 允許我們捕獲滑鼠事件,例如按鈕按下、釋放和移動。我們需要啟用這些事件來跟蹤使用者的互動。
- 捕獲滑鼠按下事件 - 當用戶單擊滑鼠按鈕以開始繪製矩形時,捕獲初始滑鼠位置。
- 捕獲滑鼠移動事件 - 當用戶移動滑鼠時,捕獲當前位置以動態更新正在繪製的矩形的大小。
- 捕獲滑鼠釋放事件 - 當用戶釋放滑鼠按鈕時,它將完成矩形的位置和大小。
- 突出顯示或選擇資料點 - 確定所選矩形內的所有資料點,並執行任何必要的操作,例如突出顯示、選擇或放大所選區域。
示例
這是另一個使用上面定義的所有實現步驟的示例。
import matplotlib.pyplot as plt
from matplotlib.patches import Rectangle
class RectangleSelector:
def __init__(self, ax):
self.ax = ax
self.start_point = None
self.rect = None
self.cid_press = ax.figure.canvas.mpl_connect('button_press_event', self.on_press)
self.cid_release = ax.figure.canvas.mpl_connect('button_release_event', self.on_release)
self.cid_motion = ax.figure.canvas.mpl_connect('motion_notify_event', self.on_motion)
def on_press(self, event):
if event.inaxes == self.ax:
self.start_point = (event.xdata, event.ydata)
self.rect = Rectangle(self.start_point, 0, 0, edgecolor='red', alpha=0.2)
self.ax.add_patch(self.rect)
def on_motion(self, event):
if self.start_point is not None and event.inaxes == self.ax:
width = event.xdata - self.start_point[0]
height = event.ydata - self.start_point[1]
self.rect.set_width(width)
self.rect.set_height(height)
self.ax.figure.canvas.draw()
def on_release(self, event):
if self.start_point is not None:
# Determine the data points within the rectangle and perform actions as needed
selected_data = self.get_data_within_rectangle()
print("Selected Data:", selected_data)
self.start_point = None
self.rect.remove()
self.ax.figure.canvas.draw()
def get_data_within_rectangle(self):
# Placeholder function to determine data points within the rectangle
# Implement logic to identify data points based on the rectangle's coordinates
return [(1, 2), (3, 4)] # Example data points
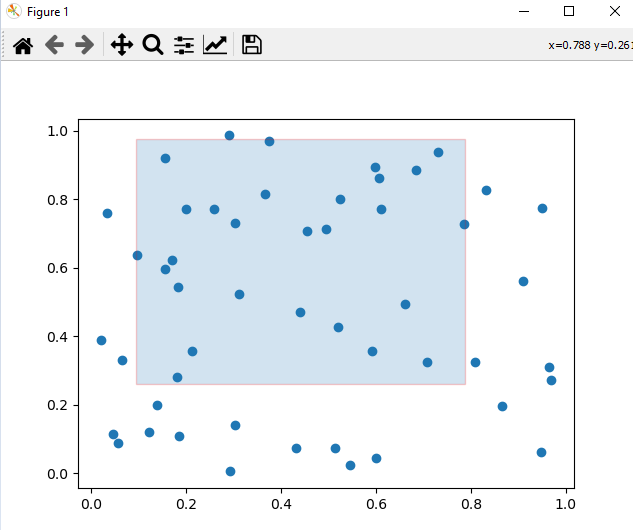
# Create a scatter plot with random data
import numpy as np
np.random.seed(42)
x_data = np.random.rand(50)
y_data = np.random.rand(50)
fig, ax = plt.subplots()
ax.scatter(x_data, y_data)
# Initialize the RectangleSelector
rect_selector = RectangleSelector(ax)
plt.show()
輸出
Selected Data: [(1, 2), (3, 4)]
實施注意事項
在我們在繪圖上實現 RectangularSelector 時,我們必須考慮以下幾點。
回撥函式 - 回撥函式應處理所選資料或根據所選區域觸發特定操作。
自定義 - 可以自定義 RectangleSelector 以滿足特定需求,例如更改矩形的外觀或設定最小跨度約束。
效能 - 根據資料集的大小,實現的效能可能會有所不同。對於大型資料集,可能需要進行最佳化。
實現示例
以下是如何在 Matplotlib 中實現簡單矩形選擇器功能的示例。
在這個示例中,我們使用onselect 和RectangleSelector() 函式來建立矩形選擇器。
onselect() - 當用戶完成繪製矩形時,將觸發此函式。它列印所選矩形的座標。
RectangleSelector() - 透過指定軸 ax、回撥函式 onselect、矩形的繪製型別 box(預設)以及其他自定義引數來建立 RectangleSelector。
示例
import matplotlib.pyplot as plt
from matplotlib.widgets import RectangleSelector
import numpy as np
# Sample data
np.random.seed(42)
x_data = np.random.rand(100)
y_data = np.random.rand(100)
# Function to be triggered on rectangle selection
def onselect(eclick, erelease):
   x1, y1 = eclick.xdata, eclick.ydata
   x2, y2 = erelease.xdata, erelease.ydata
   print(f"Selected rectangle coordinates: ({x1}, {y1}) to ({x2}, {y2})")
# Create a scatter plot
fig, ax = plt.subplots()
ax.scatter(x_data, y_data)
# Define the RectangleSelector
rect_selector = RectangleSelector(ax, onselect, useblit=True, button=[1], minspanx=5, minspany=5, spancoords='pixels')
plt.show()
輸出
Selected rectangle coordinates: (0.23518152400439746, 0.6559523809523811) to (0.6729136329804333, 1.05)
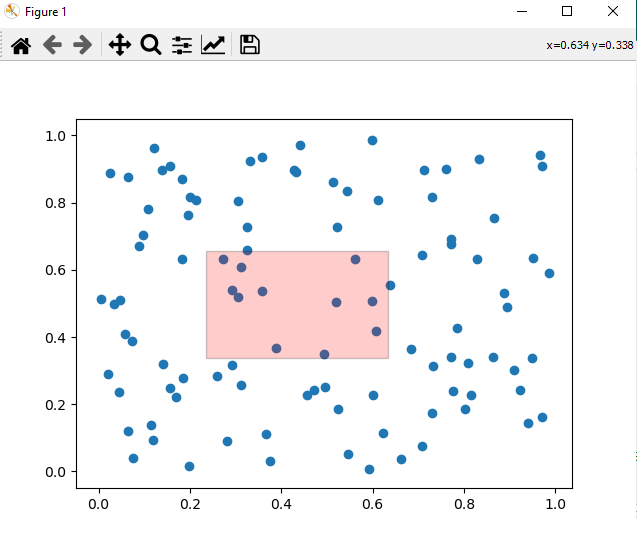
注意 - 要在繪圖上繪製矩形,請拖動游標,座標值將根據使用者選擇而變化。
廣告