- Matplotlib 基礎
- Matplotlib - 首頁
- Matplotlib - 簡介
- Matplotlib - 與 Seaborn 的比較
- Matplotlib - 環境設定
- Matplotlib - Anaconda 發行版
- Matplotlib - Jupyter Notebook
- Matplotlib - Pyplot API
- Matplotlib - 簡單繪圖
- Matplotlib - 儲存圖形
- Matplotlib - 標記
- Matplotlib - 圖形
- Matplotlib - 樣式
- Matplotlib - 圖例
- Matplotlib - 顏色
- Matplotlib - 顏色對映
- Matplotlib - 顏色對映歸一化
- Matplotlib - 選擇顏色對映
- Matplotlib - 顏色條
- Matplotlib - 文字
- Matplotlib - 文字屬性
- Matplotlib - 子圖示題
- Matplotlib - 影像
- Matplotlib - 影像蒙版
- Matplotlib - 註釋
- Matplotlib - 箭頭
- Matplotlib - 字型
- Matplotlib - 什麼是字型?
- 全域性設定字型屬性
- Matplotlib - 字型索引
- Matplotlib - 字型屬性
- Matplotlib - 座標軸刻度
- Matplotlib - 線性和對數座標軸
- Matplotlib - 對稱對數和 Logit 座標軸
- Matplotlib - LaTeX
- Matplotlib - 什麼是 LaTeX?
- Matplotlib - LaTeX 用於數學表示式
- Matplotlib - 在註釋中使用 LaTeX 格式化文字
- Matplotlib - PostScript
- 在註釋中啟用 LaTeX 渲染
- Matplotlib - 數學表示式
- Matplotlib - 動畫
- Matplotlib - 圖形物件
- Matplotlib - 使用 Cycler 進行樣式設定
- Matplotlib - 路徑
- Matplotlib - 路徑效果
- Matplotlib - 變換
- Matplotlib - 刻度和刻度標籤
- Matplotlib - 弧度刻度
- Matplotlib - 日期刻度
- Matplotlib - 刻度格式化器
- Matplotlib - 刻度定位器
- Matplotlib - 基本單位
- Matplotlib - 自動縮放
- Matplotlib - 反轉座標軸
- Matplotlib - 對數座標軸
- Matplotlib - Symlog
- Matplotlib - 單位處理
- Matplotlib - 帶單位的橢圓
- Matplotlib - 脊柱
- Matplotlib - 座標軸範圍
- Matplotlib - 座標軸刻度
- Matplotlib - 座標軸刻度
- Matplotlib - 格式化座標軸
- Matplotlib - Axes 類
- Matplotlib - 雙座標軸
- Matplotlib - Figure 類
- Matplotlib - 多圖
- Matplotlib - 網格
- Matplotlib - 面向物件介面
- Matplotlib - PyLab 模組
- Matplotlib - Subplots() 函式
- Matplotlib - Subplot2grid() 函式
- Matplotlib - 固定位置圖形物件
- Matplotlib - 手動等值線
- Matplotlib - 座標報告
- Matplotlib - AGG 過濾器
- Matplotlib - 帶狀框
- Matplotlib - 填充螺旋線
- Matplotlib - Findobj 演示
- Matplotlib - 超連結
- Matplotlib - 影像縮圖
- Matplotlib - 使用關鍵字繪圖
- Matplotlib - 建立徽標
- Matplotlib - 多頁 PDF
- Matplotlib - 多程序
- Matplotlib - 列印標準輸出
- Matplotlib - 複合路徑
- Matplotlib - Sankey 類
- Matplotlib - MRI 與 EEG
- Matplotlib - 樣式表
- Matplotlib - 背景顏色
- Matplotlib - Basemap
- Matplotlib 事件處理
- Matplotlib - 事件處理
- Matplotlib - 關閉事件
- Matplotlib - 滑鼠移動
- Matplotlib - 點選事件
- Matplotlib - 滾動事件
- Matplotlib - 按鍵事件
- Matplotlib - 選擇事件
- Matplotlib - 觀察鏡
- Matplotlib - 路徑編輯器
- Matplotlib - 多邊形編輯器
- Matplotlib - 定時器
- Matplotlib - Viewlims
- Matplotlib - 縮放視窗
- Matplotlib 小部件
- Matplotlib - 游標小部件
- Matplotlib - 帶註釋的游標
- Matplotlib - 按鈕小部件
- Matplotlib - 複選框
- Matplotlib - 套索選擇器
- Matplotlib - 選單小部件
- Matplotlib - 滑鼠游標
- Matplotlib - 多游標
- Matplotlib - 多邊形選擇器
- Matplotlib - 單選按鈕
- Matplotlib - 範圍滑塊
- Matplotlib - 矩形選擇器
- Matplotlib - 橢圓選擇器
- Matplotlib - 滑塊小部件
- Matplotlib - 跨度選擇器
- Matplotlib - 文字框
- Matplotlib 繪圖
- Matplotlib - 條形圖
- Matplotlib - 直方圖
- Matplotlib - 餅圖
- Matplotlib - 散點圖
- Matplotlib - 箱線圖
- Matplotlib - 小提琴圖
- Matplotlib - 等值線圖
- Matplotlib - 3D 繪圖
- Matplotlib - 3D 等值線
- Matplotlib - 3D 線框圖
- Matplotlib - 3D 曲面圖
- Matplotlib - Quiver 圖
- Matplotlib 有用資源
- Matplotlib - 快速指南
- Matplotlib - 有用資源
- Matplotlib - 討論
Matplotlib - Jupyter Notebook
Jupyter 是一個寬泛的首字母縮略詞,代表 Julia、Python 和 R。這些程式語言是 Jupyter 應用程式最初的目標語言,但如今,筆記本技術也支援許多其他語言。
2001 年,Fernando Pérez 開始開發 Ipython。IPython 是一種用於多種程式語言的互動式計算命令列 shell,最初是為 Python 開發的。
Jupyter Notebook 中的 Matplotlib 提供了一個互動式環境,可以在程式碼旁邊建立視覺化效果。讓我們一起了解如何在 Jupyter Notebook 中開始使用 Matplotlib 的步驟。
Jupyter Notebook 中的 Matplotlib 庫提供了一種方便的方式來互動式地視覺化資料,在進行資料分析、機器學習或任何其他基於 Python 的專案時,它允許進行探索性和解釋性的工作流程。
考慮 IPython 提供的以下功能:
互動式 Shell(終端和基於 Qt 的)。
支援程式碼、文字、數學表示式、內聯繪圖和其他媒體的基於瀏覽器的筆記本。
支援互動式資料視覺化和 GUI 工具包的使用。
靈活的、可嵌入的直譯器,可以載入到自己的專案中。
2014 年,Fernando Pérez 宣佈了一個從 IPython 分離出來的專案,稱為 Project Jupyter。IPython 將繼續作為 Python shell 和 Jupyter 的核心存在,而 IPython 的筆記本和其他與語言無關的部分將遷移到 Jupyter 名稱下。Jupyter 添加了對 Julia、R、Haskell 和 Ruby 的支援。
啟動 Jupyter Notebook
以下是逐步完成在 Jupyter Notebook 中工作的步驟。
啟動 Jupyter Notebook
開啟 Anaconda Navigator。
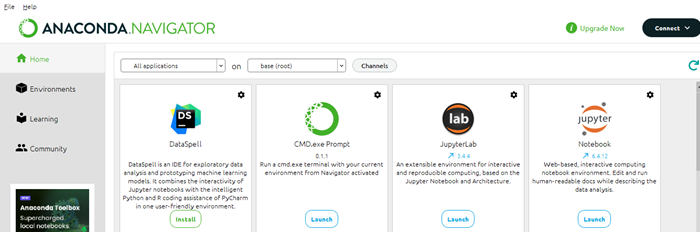
從 Navigator 啟動 Jupyter Notebook,或者在終端/Anaconda Prompt 中鍵入jupyter notebook 並按 Enter 鍵。
建立或開啟筆記本
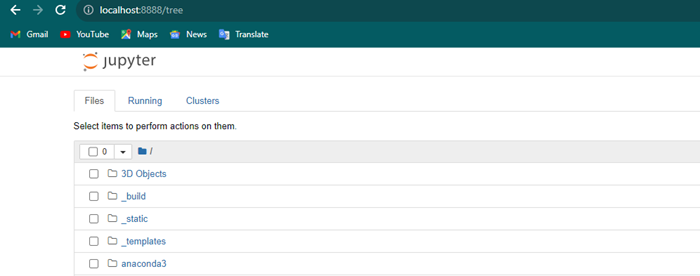
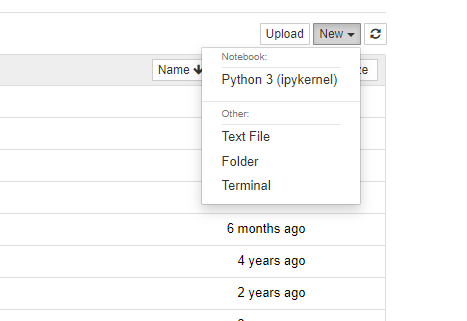
Jupyter Notebook 在我們的 Web 瀏覽器中開啟後,導航到我們想要工作的目錄。
單擊“新建”並選擇一個 Python 筆記本,通常稱為“無標題”筆記本。
匯入 Matplotlib
在 Jupyter Notebook 單元格中,使用以下程式碼行匯入 Matplotlib 庫。
import matplotlib.pyplot as plt
%matplotlib inline
%matplotlib inline 是一個魔法命令,它告訴 Jupyter Notebook 在筆記本中內聯顯示 Matplotlib 繪圖。
建立繪圖
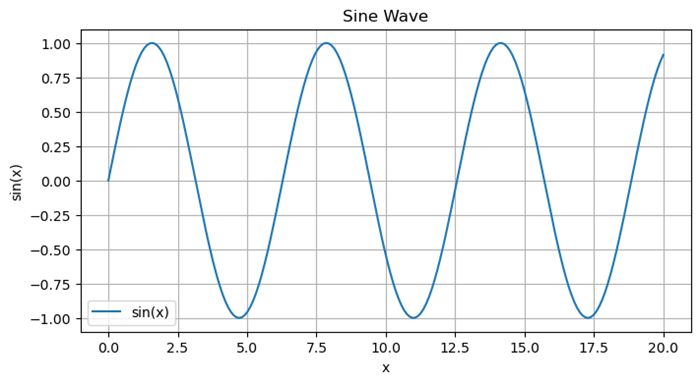
現在我們可以使用 Matplotlib 函式建立繪圖。例如,讓我們使用 numpy 資料建立一個折線圖。
示例
import numpy as np
import matplotlib.pyplot as plt
# Generating sample data
x = np.linspace(0, 20, 200)
y = np.sin(x)
# Plotting the data
plt.figure(figsize=(8, 4))
plt.plot(x, y, label='sin(x)')
plt.title('Sine Wave')
plt.xlabel('x')
plt.ylabel('sin(x)')
plt.legend()
plt.grid(True)
plt.show()
輸出
與繪圖互動
生成繪圖後,它將直接顯示在筆記本中單元格下方。如果我們在匯入階段使用了%matplotlib notebook 而不是%matplotlib inline,則可以與繪圖進行互動,例如平移和縮放。
多個繪圖
我們可以透過建立新的單元格並執行更多 Matplotlib 命令來建立多個繪圖。
Markdown 單元格
我們可以在程式碼單元格上方或之間新增 Markdown 單元格中的解釋性文字,以描述我們的繪圖或分析。
儲存繪圖
我們可以使用plt.savefig('filename.png') 將繪圖儲存為 Jupyter 環境中的影像檔案。
關閉 Jupyter Notebook
完成筆記本工作後,我們可以從 Jupyter Notebook 介面關閉它,或者關閉啟動 Jupyter Notebook 的終端/Anaconda Prompt。
隱藏 Jupyter 筆記本中的 Matplotlib 描述
要隱藏在呼叫 plot() 方法時例項的 Matplotlib 描述,我們可以採取以下步驟
開啟 Ipython 例項。
import numpy as np
from matplotlib import pyplot as plt
為 x 建立點,即 np.linspace(1, 10, 1000)
現在,使用 plot() 方法繪製線條。
要隱藏例項,請使用 plt.plot(x); (帶分號)
或者,使用 _ = plt.plot(x)
示例
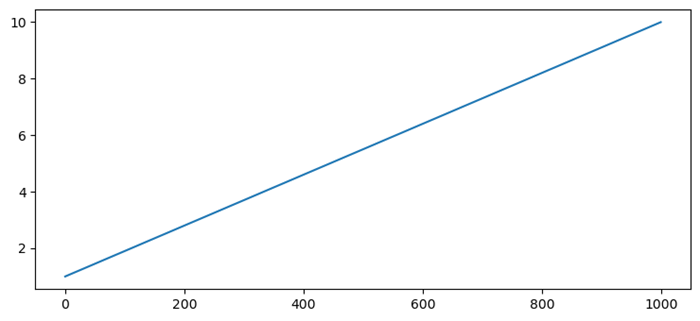
在此示例中,我們隱藏了描述程式碼。
import numpy as np
from matplotlib import pyplot as plt
x = np.linspace(1, 10, 1000)
plt.plot(x)
plt.show()
輸出
[<matplotlib.lines.Line2D at 0x1f6d31d9130>]