- Matplotlib 基礎
- Matplotlib - 首頁
- Matplotlib - 簡介
- Matplotlib - 與 Seaborn 的比較
- Matplotlib - 環境設定
- Matplotlib - Anaconda 發行版
- Matplotlib - Jupyter Notebook
- Matplotlib - Pyplot API
- Matplotlib - 簡單繪圖
- Matplotlib - 儲存圖形
- Matplotlib - 標記
- Matplotlib - 圖形
- Matplotlib - 樣式
- Matplotlib - 圖例
- Matplotlib - 顏色
- Matplotlib - 色圖
- Matplotlib - 色圖歸一化
- Matplotlib - 選擇色圖
- Matplotlib - 色標
- Matplotlib - 文字
- Matplotlib - 文字屬性
- Matplotlib - 子圖示題
- Matplotlib - 影像
- Matplotlib - 影像遮罩
- Matplotlib - 註釋
- Matplotlib - 箭頭
- Matplotlib - 字型
- Matplotlib - 什麼是字型?
- 全域性設定字型屬性
- Matplotlib - 字型索引
- Matplotlib - 字型屬性
- Matplotlib - 刻度
- Matplotlib - 線性與對數刻度
- Matplotlib - 對稱對數和 Logit 刻度
- Matplotlib - LaTeX
- Matplotlib - 什麼是 LaTeX?
- Matplotlib - LaTeX 用於數學表示式
- Matplotlib - LaTeX 在註釋中的文字格式化
- Matplotlib - PostScript
- 在註釋中啟用 LaTeX 渲染
- Matplotlib - 數學表示式
- Matplotlib - 動畫
- Matplotlib - 圖形物件
- Matplotlib - 使用 Cycler 進行樣式設定
- Matplotlib - 路徑
- Matplotlib - 路徑效果
- Matplotlib - 轉換
- Matplotlib - 刻度和刻度標籤
- Matplotlib - 弧度刻度
- Matplotlib - 日期刻度
- Matplotlib - 刻度格式化器
- Matplotlib - 刻度定位器
- Matplotlib - 基本單位
- Matplotlib - 自動縮放
- Matplotlib - 反轉軸
- Matplotlib - 對數軸
- Matplotlib - Symlog
- Matplotlib - 單位處理
- Matplotlib - 帶單位的橢圓
- Matplotlib - 脊柱
- Matplotlib - 軸範圍
- Matplotlib - 軸刻度
- Matplotlib - 軸刻度
- Matplotlib - 格式化軸
- Matplotlib - Axes 類
- Matplotlib - 雙軸
- Matplotlib - Figure 類
- Matplotlib - 多圖
- Matplotlib - 網格
- Matplotlib - 面向物件介面
- Matplotlib - PyLab 模組
- Matplotlib - subplots() 函式
- Matplotlib - subplot2grid() 函式
- Matplotlib - 固定圖形物件
- Matplotlib - 手動等值線
- Matplotlib - 座標報告
- Matplotlib - AGG 過濾器
- Matplotlib - 帶狀框
- Matplotlib - 填充螺旋線
- Matplotlib - findobj 演示
- Matplotlib - 超連結
- Matplotlib - 影像縮圖
- Matplotlib - 使用關鍵字繪圖
- Matplotlib - 建立徽標
- Matplotlib - 多頁 PDF
- Matplotlib - 多程序
- Matplotlib - 列印標準輸出
- Matplotlib - 複合路徑
- Matplotlib - Sankey 類
- Matplotlib - MRI 與 EEG
- Matplotlib - 樣式表
- Matplotlib - 背景顏色
- Matplotlib - Basemap
- Matplotlib 事件處理
- Matplotlib - 事件處理
- Matplotlib - 關閉事件
- Matplotlib - 滑鼠移動
- Matplotlib - 點選事件
- Matplotlib - 滾動事件
- Matplotlib - 按鍵事件
- Matplotlib - 選擇事件
- Matplotlib - 透鏡
- Matplotlib - 路徑編輯器
- Matplotlib - 多邊形編輯器
- Matplotlib - 定時器
- Matplotlib - Viewlims
- Matplotlib - 縮放視窗
- Matplotlib 小部件
- Matplotlib - 游標小部件
- Matplotlib - 帶註釋的游標
- Matplotlib - 按鈕小部件
- Matplotlib - 複選框
- Matplotlib - 套索選擇器
- Matplotlib - 選單小部件
- Matplotlib - 滑鼠游標
- Matplotlib - 多游標
- Matplotlib - 多邊形選擇器
- Matplotlib - 單選按鈕
- Matplotlib - 範圍滑塊
- Matplotlib - 矩形選擇器
- Matplotlib - 橢圓選擇器
- Matplotlib - 滑塊小部件
- Matplotlib - 跨度選擇器
- Matplotlib - 文字框
- Matplotlib 繪圖
- Matplotlib - 條形圖
- Matplotlib - 直方圖
- Matplotlib - 餅圖
- Matplotlib - 散點圖
- Matplotlib - 箱線圖
- Matplotlib - 小提琴圖
- Matplotlib - 等值線圖
- Matplotlib - 3D 繪圖
- Matplotlib - 3D 等值線
- Matplotlib - 3D 線框圖
- Matplotlib - 3D 表面圖
- Matplotlib - Quiver 圖
- Matplotlib 有用資源
- Matplotlib - 快速指南
- Matplotlib - 有用資源
- Matplotlib - 討論
Matplotlib - 影像遮罩
在 Matplotlib 庫中,影像遮罩涉及根據指定的遮罩選擇性地顯示影像的某些部分,遮罩本質上是一個二值影像,用於定義要顯示或隱藏的區域。它允許我們應用過濾器或條件來顯示或隱藏影像的特定部分。
影像遮罩的過程
以下是執行影像遮罩的過程步驟。
建立遮罩
定義建立遮罩的標準或模式。它可以基於顏色、形狀、漸變或特定的畫素值。
應用遮罩
使用遮罩修改原始影像中相應畫素的透明度或可見性。與遮罩中定義為“遮罩”區域相對應的畫素通常會被隱藏或變得透明,而其他畫素則保持可見。
疊加或混合
將遮罩影像與另一幅影像或背景疊加或混合,僅顯示未遮罩的部分。可以將遮罩影像疊加在另一幅影像上,以組合和顯示可見區域。
影像遮罩的型別
以下是影像遮罩的型別。
二值遮罩
由黑色和白色畫素組成,其中白色表示可見區域,黑色表示遮罩區域。
灰度遮罩
使用各種灰度來定義透明度或部分可見性的級別。
影像遮罩的工具和技術
我們可以使用不同的工具和技術進行影像遮罩。
手動遮罩
Photoshop 或 GIMP 等工具允許使用者使用選擇工具、畫筆或圖層遮罩手動建立和編輯遮罩。
程式設計遮罩
在 Python 等程式語言中,使用 OpenCV 或 PIL (Pillow) 等庫,我們可以使用基於顏色閾值、輪廓或特定影像特徵的演算法建立遮罩。
關鍵點
Matplotlib 中的影像遮罩涉及建立與影像具有相同維度的遮罩陣列,其中標記特定區域以隱藏(遮罩)或顯示(未遮罩)影像的部分。
遮罩陣列由布林值或數值組成,其中**True** 或非零值表示要顯示的區域,而**False** 或零值表示要隱藏的區域。
遮罩允許根據指定的條件或標準選擇性地視覺化或操作影像的特定部分。
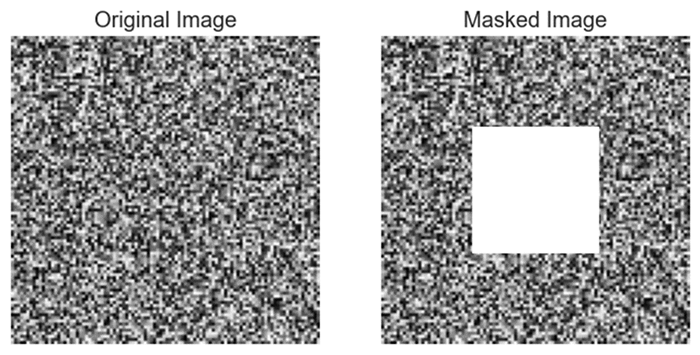
遮罩影像的特定區域
假設我們有一幅影像,並希望遮罩某個特定區域,僅根據某些標準顯示影像的一部分。
示例
import matplotlib.pyplot as plt
import numpy as np

# Create a sample image (random pixels)
image = np.random.rand(100, 100)

# Create a mask to hide certain parts of the image
mask = np.zeros_like(image)
mask[30:70, 30:70] = 1  # Masking a square region

# Apply the mask to the image
masked_image = np.ma.masked_array(image, mask=mask)

# Display the original and masked images
plt.figure(figsize=(8, 4))
plt.subplot(1, 2, 1)
plt.imshow(image, cmap='gray')
plt.title('Original Image')
plt.axis('off')
plt.subplot(1, 2, 2)
plt.imshow(masked_image, cmap='gray')
plt.title('Masked Image')
plt.axis('off')
plt.show()
輸出
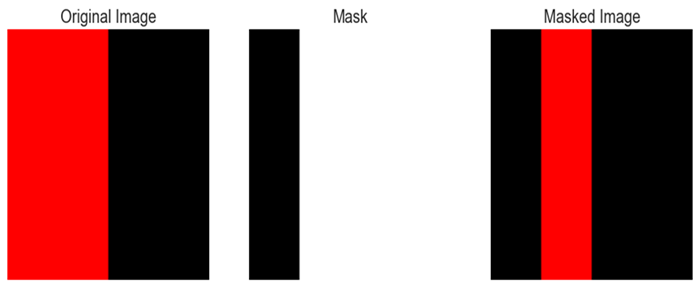
將遮罩應用於影像
這裡這是另一個使用 matplotlib 庫遮罩影像的示例。
示例
import matplotlib.pyplot as plt
import numpy as np

# Create a sample image
image_size = 100
img = np.zeros((image_size, image_size, 3), dtype=np.uint8)
img[:, :image_size // 2] = [255, 0, 0]  # Set the left half to blue

# Create a binary mask
mask = np.zeros((image_size, image_size), dtype=np.uint8)
mask[:, image_size // 4:] = 1  # Set the right quarter to 1

# Apply the mask to the image
masked_img = img * mask[:, :, np.newaxis]

# Display the original image, mask, and the masked image
plt.figure(figsize=(12, 4))
plt.subplot(131)
plt.imshow(img)
plt.title('Original Image')
plt.axis('off')
plt.subplot(132)
plt.imshow(mask, cmap='gray')
plt.title('Mask')
plt.axis('off')
plt.subplot(133)
plt.imshow(masked_img)
plt.title('Masked Image')
plt.axis('off')
plt.show()
輸出
廣告