- Matplotlib 基礎
- Matplotlib - 首頁
- Matplotlib - 簡介
- Matplotlib - 與 Seaborn 的比較
- Matplotlib - 環境設定
- Matplotlib - Anaconda 發行版
- Matplotlib - Jupyter Notebook
- Matplotlib - Pyplot API
- Matplotlib - 簡單繪圖
- Matplotlib - 儲存圖片
- Matplotlib - 標記
- Matplotlib - 圖形
- Matplotlib - 樣式
- Matplotlib - 圖例
- Matplotlib - 顏色
- Matplotlib - 顏色圖
- Matplotlib - 顏色圖歸一化
- Matplotlib - 選擇顏色圖
- Matplotlib - 顏色條
- Matplotlib - 文字
- Matplotlib - 文字屬性
- Matplotlib - 子圖示題
- Matplotlib - 圖片
- Matplotlib - 圖片蒙版
- Matplotlib - 註釋
- Matplotlib - 箭頭
- Matplotlib - 字型
- Matplotlib - 什麼是字型?
- 全域性設定字型屬性
- Matplotlib - 字型索引
- Matplotlib - 字型屬性
- Matplotlib - 比例尺
- Matplotlib - 線性與對數比例尺
- Matplotlib - 對稱對數和 Logit 比例尺
- Matplotlib - LaTeX
- Matplotlib - 什麼是 LaTeX?
- Matplotlib - 用於數學表示式的 LaTeX
- Matplotlib - 註釋中的 LaTeX 文字格式
- Matplotlib - PostScript
- 啟用註釋中的 LaTeX 渲染
- Matplotlib - 數學表示式
- Matplotlib - 動畫
- Matplotlib - 圖元
- Matplotlib - 使用 Cycler 進行樣式設定
- Matplotlib - 路徑
- Matplotlib - 路徑效果
- Matplotlib - 變換
- Matplotlib - 刻度和刻度標籤
- Matplotlib - 弧度刻度
- Matplotlib - 日期刻度
- Matplotlib - 刻度格式化程式
- Matplotlib - 刻度定位器
- Matplotlib - 基本單位
- Matplotlib - 自動縮放
- Matplotlib - 反轉座標軸
- Matplotlib - 對數座標軸
- Matplotlib - Symlog
- Matplotlib - 單位處理
- Matplotlib - 帶單位的橢圓
- Matplotlib - 脊柱
- Matplotlib - 座標軸範圍
- Matplotlib - 座標軸比例尺
- Matplotlib - 座標軸刻度
- Matplotlib - 格式化座標軸
- Matplotlib - Axes 類
- Matplotlib - 雙座標軸
- Matplotlib - Figure 類
- Matplotlib - 多圖
- Matplotlib - 網格
- Matplotlib - 面向物件介面
- Matplotlib - PyLab 模組
- Matplotlib - Subplots() 函式
- Matplotlib - Subplot2grid() 函式
- Matplotlib - 錨定圖元
- Matplotlib - 手動等高線
- Matplotlib - 座標報告
- Matplotlib - AGG 濾鏡
- Matplotlib - 帶狀框
- Matplotlib - 填充螺旋線
- Matplotlib - Findobj 演示
- Matplotlib - 超連結
- Matplotlib - 圖片縮圖
- Matplotlib - 使用關鍵字繪圖
- Matplotlib - 建立 Logo
- Matplotlib - 多頁 PDF
- Matplotlib - 多程序
- Matplotlib - 列印標準輸出
- Matplotlib - 複合路徑
- Matplotlib - Sankey 類
- Matplotlib - MRI 與 EEG
- Matplotlib - 樣式表
- Matplotlib - 背景顏色
- Matplotlib - Basemap
- Matplotlib 事件處理
- Matplotlib - 事件處理
- Matplotlib - 關閉事件
- Matplotlib - 滑鼠移動
- Matplotlib - 點選事件
- Matplotlib - 滾動事件
- Matplotlib - 按鍵事件
- Matplotlib - 選擇事件
- Matplotlib - 透視鏡
- Matplotlib - 路徑編輯器
- Matplotlib - 多邊形編輯器
- Matplotlib - 定時器
- Matplotlib - Viewlims
- Matplotlib - 縮放視窗
- Matplotlib 小部件
- Matplotlib - 游標小部件
- Matplotlib - 帶註釋的游標
- Matplotlib - 按鈕小部件
- Matplotlib - 複選框
- Matplotlib - 套索選擇器
- Matplotlib - 選單小部件
- Matplotlib - 滑鼠游標
- Matplotlib - 多游標
- Matplotlib - 多邊形選擇器
- Matplotlib - 單選按鈕
- Matplotlib - RangeSlider
- Matplotlib - 矩形選擇器
- Matplotlib - 橢圓選擇器
- Matplotlib - 滑塊小部件
- Matplotlib - 區間選擇器
- Matplotlib - 文字框
- Matplotlib 繪圖
- Matplotlib - 條形圖
- Matplotlib - 直方圖
- Matplotlib - 餅圖
- Matplotlib - 散點圖
- Matplotlib - 箱線圖
- Matplotlib - 小提琴圖
- Matplotlib - 等高線圖
- Matplotlib - 3D 繪圖
- Matplotlib - 3D 等高線
- Matplotlib - 3D 線框圖
- Matplotlib - 3D 表面圖
- Matplotlib - Quiver 圖
- Matplotlib 有用資源
- Matplotlib - 快速指南
- Matplotlib - 有用資源
- Matplotlib - 討論
Matplotlib - 按鍵事件
在計算機程式設計中,檢測和處理按鍵事件對於捕獲使用者輸入並在應用程式中啟用各種功能至關重要。無論是瀏覽選單、輸入文字、觸發操作還是控制互動式元素,按鍵事件都在使用者互動中扮演著關鍵角色。
Matplotlib 提供了處理按鍵事件的工具,允許您在互動式繪圖會話中捕獲和響應鍵盤輸入。當按下鍵時,Matplotlib 會觸發key_press_event,允許使用者根據按下的鍵定義自定義操作。
該庫預設附加了一些按鍵回撥以增強互動性。這些預設回撥在 Matplotlib 文件的“導航鍵盤快捷鍵”部分中有說明。
示例
讓我們來看這個基本的示例,它演示了 Matplotlib 中預設的按鍵事件。
import numpy as np
import matplotlib.pyplot as plt
# Define a function to handle keypress events
def press(event):
print('You pressed:', event.key)
# Create a Matplotlib figure and axis
fig, ax = plt.subplots()
# Connect the keypress event handler to the figure canvas
cid = fig.canvas.mpl_connect('key_press_event', press)
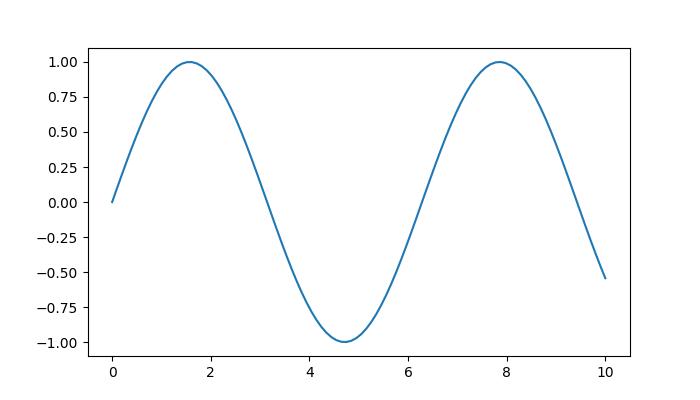
# Plot sin wave
x = np.linspace(0, 10, 100)
ax.plot(x, np.sin(x))
# Display the plot
plt.show()
輸出
執行上述程式後,您將獲得以下圖形,然後按任意鍵觀察此示例的工作方式:
You pressed: tab
You pressed: caps_lock
You pressed: shift
You pressed: control
You pressed: alt
You pressed: meta
You pressed: a
You pressed: b
You pressed: c
You pressed: d
You pressed: s
You pressed: g
You pressed: g
You pressed: g
You pressed: g
You pressed: k
You pressed: k
You pressed: k
You pressed: k
You pressed: k
You pressed: k
You pressed: l
You pressed: l
You pressed: p
You pressed: p
You pressed: q
觀看下面的影片,瞭解此按鍵事件功能在此處如何工作。

從以上輸出中,您可以觀察到一些預設鍵的工作方式,例如“g”(切換網格),“s”(儲存圖形),“q”(關閉圖形)等等。
建立自定義按鍵事件函式
要根據特定需求處理按鍵事件,您可以建立一個自定義函式,並使用mpl_connect方法將其連線到key_press_event。
示例
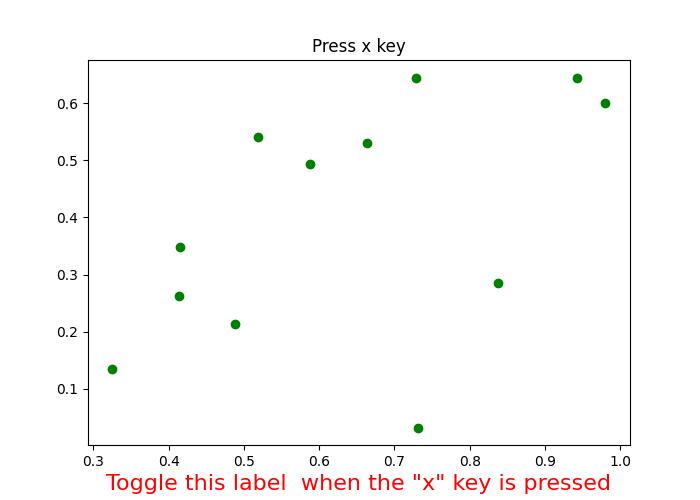
以下示例演示了一個簡單的按鍵事件函式,當按下“x”鍵時,該函式會切換 x 軸標籤的可見性。
import sys
import matplotlib.pyplot as plt
import numpy as np

def on_press(event):
   print('Pressed key:', event.key)
   sys.stdout.flush()

   # Toggle visibility of xlabel when 'x' key is pressed
   if event.key == 'x':
      visible = xl.get_visible()
      xl.set_visible(not visible)
      fig.canvas.draw()

fig, ax = plt.subplots()
fig.canvas.mpl_connect('key_press_event', on_press)

# Plot random data points
ax.plot(np.random.rand(12), np.random.rand(12), 'go')
xl = ax.set_xlabel('Toggle this label  when the "x" key is pressed',
   fontsize=16, color='red')
ax.set_title('Press x key')

plt.show()
輸出
執行上述程式後,您將獲得以下圖形,然後按任意鍵觀察此示例的工作方式:
Pressed key: x
Pressed key: x
Pressed key: x
Pressed key: x
Pressed key: a
Pressed key: enter
觀看下面的影片,瞭解此按鍵事件功能在此處如何工作。

示例
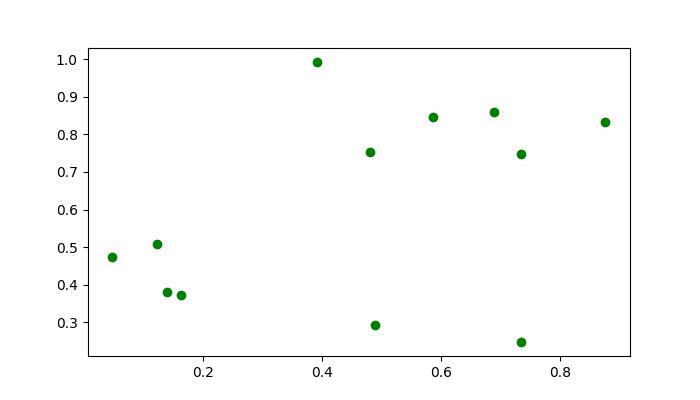
這是另一個示例,它演示瞭如何新增Esc鍵以退出圖形(除了“q”鍵之外),並計算Enter鍵被按下的次數。
import numpy as np
import matplotlib.pyplot as plt

# Define a function to handle keypress events
def press(event):
   print('Pressed key:', event.key)

   # If the 'enter' key is pressed, append 1 to the count list
   if event.key == 'enter':
      cnt.append(1)

   # If the 'escape' key is pressed, close the plot
   if event.key == "escape":
      plt.close()

cnt = []

# Create a figure
fig, ax = plt.subplots()

# Connect the keypress event handler to the figure canvas
fig.canvas.mpl_connect('key_press_event', press)
ax.plot(np.random.rand(12), np.random.rand(12), 'go')
plt.show()

# Calculate and print the sum of counts
result = sum(cnt)
print(result, cnt)
輸出
執行上述程式後,您將獲得以下圖形,然後按任意鍵觀察此示例的工作方式:
Pressed key: b
Pressed key: enter
Pressed key: enter
Pressed key: caps_lock
Pressed key: caps_lock
Pressed key: enter
Pressed key: escape
3 [1, 1, 1]

廣告