- Matplotlib 基礎
- Matplotlib - 首頁
- Matplotlib - 簡介
- Matplotlib - 對比 Seaborn
- Matplotlib - 環境設定
- Matplotlib - Anaconda 發行版
- Matplotlib - Jupyter Notebook
- Matplotlib - Pyplot API
- Matplotlib - 簡單繪圖
- Matplotlib - 儲存圖形
- Matplotlib - 標記
- Matplotlib - 圖形
- Matplotlib - 樣式
- Matplotlib - 圖例
- Matplotlib - 顏色
- Matplotlib - 顏色圖
- Matplotlib - 顏色圖歸一化
- Matplotlib - 選擇顏色圖
- Matplotlib - 色標
- Matplotlib - 文字
- Matplotlib - 文字屬性
- Matplotlib - 子圖示題
- Matplotlib - 影像
- Matplotlib - 影像掩碼
- Matplotlib - 註釋
- Matplotlib - 箭頭
- Matplotlib - 字型
- Matplotlib - 什麼是字型?
- 全域性設定字型屬性
- Matplotlib - 字型索引
- Matplotlib - 字型屬性
- Matplotlib - 刻度
- Matplotlib - 線性和對數刻度
- Matplotlib - 對稱對數和 Logit 刻度
- Matplotlib - LaTeX
- Matplotlib - 什麼是 LaTeX?
- Matplotlib - LaTeX 用於數學表示式
- Matplotlib - LaTeX 文字格式化在註釋中
- Matplotlib - PostScript
- 在註釋中啟用 LaTeX 渲染
- Matplotlib - 數學表示式
- Matplotlib - 動畫
- Matplotlib - 圖形物件
- Matplotlib - 使用 Cycler 進行樣式設定
- Matplotlib - 路徑
- Matplotlib - 路徑效果
- Matplotlib - 轉換
- Matplotlib - 刻度和刻度標籤
- Matplotlib - 弧度刻度
- Matplotlib - 日期刻度
- Matplotlib - 刻度格式化器
- Matplotlib - 刻度定位器
- Matplotlib - 基本單位
- Matplotlib - 自動縮放
- Matplotlib - 反轉軸
- Matplotlib - 對數軸
- Matplotlib - Symlog
- Matplotlib - 單位處理
- Matplotlib - 帶單位的橢圓
- Matplotlib - 脊柱
- Matplotlib - 軸範圍
- Matplotlib - 軸刻度
- Matplotlib - 軸刻度
- Matplotlib - 格式化軸
- Matplotlib - Axes 類
- Matplotlib - 雙軸
- Matplotlib - Figure 類
- Matplotlib - 多圖
- Matplotlib - 網格
- Matplotlib - 面向物件介面
- Matplotlib - PyLab 模組
- Matplotlib - Subplots() 函式
- Matplotlib - Subplot2grid() 函式
- Matplotlib - 錨定圖形物件
- Matplotlib - 手動等值線
- Matplotlib - 座標報告
- Matplotlib - AGG 過濾器
- Matplotlib - 帶狀框
- Matplotlib - 填充螺旋
- Matplotlib - Findobj 演示
- Matplotlib - 超連結
- Matplotlib - 影像縮圖
- Matplotlib - 使用關鍵字繪圖
- Matplotlib - 建立徽標
- Matplotlib - 多頁 PDF
- Matplotlib - 多程序
- Matplotlib - 列印標準輸出
- Matplotlib - 複合路徑
- Matplotlib - Sankey 類
- Matplotlib - MRI 與 EEG
- Matplotlib - 樣式表
- Matplotlib - 背景顏色
- Matplotlib - Basemap
- Matplotlib 事件處理
- Matplotlib - 事件處理
- Matplotlib - 關閉事件
- Matplotlib - 滑鼠移動
- Matplotlib - 點選事件
- Matplotlib - 滾動事件
- Matplotlib - 按鍵事件
- Matplotlib - 選擇事件
- Matplotlib - 放大鏡
- Matplotlib - 路徑編輯器
- Matplotlib - 多邊形編輯器
- Matplotlib - 定時器
- Matplotlib - Viewlims
- Matplotlib - 縮放視窗
- Matplotlib 小部件
- Matplotlib - 游標小部件
- Matplotlib - 帶註釋的游標
- Matplotlib - 按鈕小部件
- Matplotlib - 複選框
- Matplotlib - 套索選擇器
- Matplotlib - 選單小部件
- Matplotlib - 滑鼠游標
- Matplotlib - 多游標
- Matplotlib - 多邊形選擇器
- Matplotlib - 單選按鈕
- Matplotlib - 範圍滑塊
- Matplotlib - 矩形選擇器
- Matplotlib - 橢圓選擇器
- Matplotlib - 滑塊小部件
- Matplotlib - 跨度選擇器
- Matplotlib - 文字框
- Matplotlib 繪圖
- Matplotlib - 條形圖
- Matplotlib - 直方圖
- Matplotlib - 餅圖
- Matplotlib - 散點圖
- Matplotlib - 箱線圖
- Matplotlib - 小提琴圖
- Matplotlib - 等值線圖
- Matplotlib - 3D 繪圖
- Matplotlib - 3D 等值線
- Matplotlib - 3D 線框圖
- Matplotlib - 3D 表面圖
- Matplotlib - Quiver 圖
- Matplotlib 有用資源
- Matplotlib - 快速指南
- Matplotlib - 有用資源
- Matplotlib - 討論
Matplotlib - 環境設定
Matplotlib 庫與各種作業系統和 Python 環境高度相容。設定 Matplotlib 相對簡單,其多功能性使其成為 Python 中視覺化資料的寶貴工具。它涉及確保已安裝它並在我們的 Python 環境中配置其行為。
以下是設定 matplotlib 庫環境的分步指南。
安裝
Matplotlib 通常包含在 Anaconda 等 Python 發行版中。但是,如果未安裝,我們可以使用 pip 進行安裝。以下是安裝 matplotlib 庫的命令。
pip install matplotlib
檢查安裝
如果我們想驗證安裝是否完成,則開啟 Python 直譯器或 Jupyter Notebook,並使用以下程式碼行匯入 Matplotlib 庫的 pyplot 模組。
import matplotlib.pyplot as plt
如果未出現錯誤,則安裝成功,否則安裝過程中存在問題。
後端選擇
Matplotlib 具有不同的“後端”,負責渲染繪圖。這些後端可以在不同的環境中顯示圖形,例如在 Jupyter Notebook 中,一個單獨的視窗等。
互動式後端(非常適合 Jupyter Notebook)
為了在 Jupyter Notebook 中啟用互動式繪圖,我們使用魔法命令 %matplotlib。以下是需要執行的程式碼行。
%matplotlib inline
# or
%matplotlib notebook
%matplotlib inline 命令在筆記本中顯示繪圖的靜態影像,而 %matplotlib notebook 允許互動式繪圖,例如平移和縮放。
非互動式後端(不使用 Jupyter 時)
在不使用 Jupyter 環境時,Matplotlib 可以使用非互動式後端。它會自動為我們的系統選擇合適的後端。我們可以顯式設定後端。
import matplotlib
matplotlib.use('Agg')  # Backend selection, 'Agg' for non-interactive backend
配置和樣式
Matplotlib 允許自定義預設設定和樣式。我們可以建立一個名為 `matplotlibrc` 的配置檔案來自定義行為。
查詢配置檔案
要查詢 Matplotlib 配置檔案的位置,我們可以使用 Python 編輯器執行以下程式碼。
import matplotlib
matplotlib.matplotlib_fname()
建立/編輯配置
我們可以直接修改此檔案或建立一個新檔案來調整各種設定,例如預設圖形大小、線型、字型等。測試設定
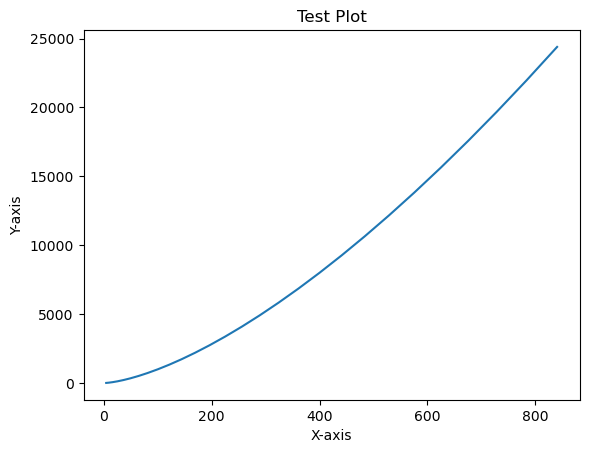
為了確保一切設定正確,我們可以使用 Matplotlib 建立一個簡單的繪圖。
示例
import matplotlib.pyplot as plt
x = [i2 for i in range(2,30)]
y = [i3 for i in range(2,30)]
plt.plot(x, y)
plt.xlabel('X-axis')
plt.ylabel('Y-axis')
plt.title('Test Plot')
plt.show()
執行此程式碼應該在所選環境中顯示一個帶有折線圖的簡單繪圖。
輸出
如果所有使用者都沒有安裝 Python 2.7 或 3.4 版本,則需要安裝 Microsoft Visual C++ 2008(Python 2.7 的 64 位或 32 位)或 Microsoft Visual C++ 2010(Python 3.4 的 64 位或 32 位)可再發行軟體包。
如果您在 Mac 上使用 Python 2.7,請執行以下命令:
xcode-select -install
執行上述命令後,可能會編譯 subprocess32 - 一個依賴項。
在極其舊版本的 Linux 和 Python 2.7 上,您可能需要安裝 subprocess32 的 master 版本。
Matplotlib 需要大量依賴項:
Python (>= 2.7 或 >= 3.4)
NumPy
setuptools
dateutil
pyparsing
libpng
pytz
FreeType
cycler
six
或者,您還可以安裝許多軟體包以啟用更好的使用者介面工具包。
tk
PyQt4
PyQt5
pygtk
wxpython
pycairo
Tornado
為了更好地支援動畫輸出格式和影像檔案格式、LaTeX 等,您可以安裝以下內容:
_mpeg/avconv
ImageMagick
Pillow (>=2.0)
LaTeX 和 GhostScript(用於使用 LaTeX 渲染文字)。
LaTeX 和 GhostScript(用於使用 LaTeX 渲染文字)。