- 能力傾向有用資源
- 能力傾向 - 問答
折線圖 - 線上測驗
以下測驗提供了與折線圖相關的多項選擇題 (MCQ)。您需要閱讀所有給定的答案,然後點選正確的答案。如果您不確定答案,可以使用顯示答案按鈕檢查答案。您可以使用下一題按鈕在測驗中檢視新的問題集。

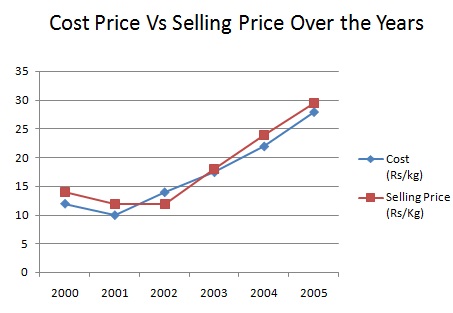
說明:下圖顯示了某商品多年來的組裝量(以公斤計)、成本價(盧比/公斤)和銷售價(盧比/公斤)。仔細研究圖表並回答以下問題
答案 - C
解釋
benefit created :
2000 = Rs [(14-12)*120] = Rs.240
2001 = Rs [(12-10)*150] = Rs. 300
2004 = Rs [(24-22)*160] = Rs. 320
2005 = Rs [(29.5-28)*170] = Rs. 255
說明:下圖顯示了某商品多年來的組裝量(以公斤計)、成本價(盧比/公斤)和銷售價(盧比/公斤)。仔細研究圖表並回答以下問題
問題 2 - 如果 2005 年到 2006 年的成本價格增長百分比與 2004 年到 2005 年的增長百分比相同,那麼 2006 年的成本價格總計是多少盧比/公斤?
答案 - B
解釋
Percent development in expense from 2004 to 2005 .
= {(28-22)/22*100} % = (6/22*100) % = 300/11%
Taken a toll for every Kg in 2006
= Rs. [28+ (300/11 *1/100* 28)] = Rs. 392/11 = Rs. 35.63
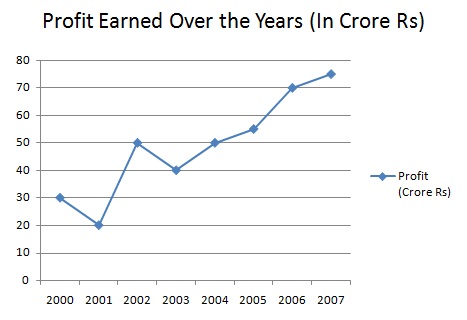
說明:仔細研究下圖並回答以下問題
答案 - B
解釋
Gain in 2005 = income- expenditure
⇒ Income = (gain+ expenditure) = (60+55) = 115 crore.
說明:仔細研究下圖並回答以下問題
答案 - A
解釋
Expenditure in 2001  =( 60-25) = 35 crore
∴  income in the year 2003 = (35+40) = 75 crores.
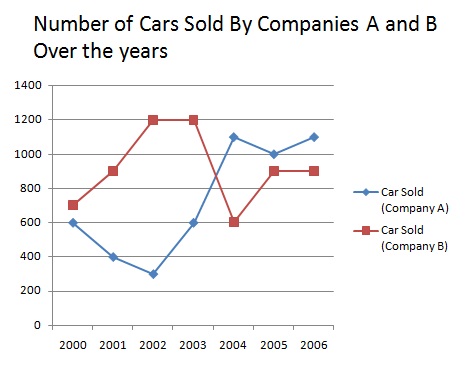
說明:仔細研究下圖並回答以下問題
答案 - A
解釋
Total sale of Company A in 2004  =1100
Total sale of A during These years = (600+900+300+600+1100+1000+1100)= 5600
Required % = (1100/5600*100) % = 19.64%
說明:仔細研究下圖並回答以下問題
問題 6 - 公司 B 在 2000 年、2001 年和 2004 年的銷售額總和佔公司 B 所有年份銷售額總和的百分比是多少?
答案 - C
解釋
Total sale of B for the year 2000, 2001 and 2004 = (700+400+600) = 1700
Total sales of B over the years = (700+400+1200+1200+600+900+900) =  5900
∴ Required % = (1700/5900*100) % = 28.81%
說明:仔細研究下圖並回答以下問題
答案 - D
解釋
Required number = 5600:5900 = 56:59
說明:仔細研究下圖並回答以下問題
答案 - B
解釋
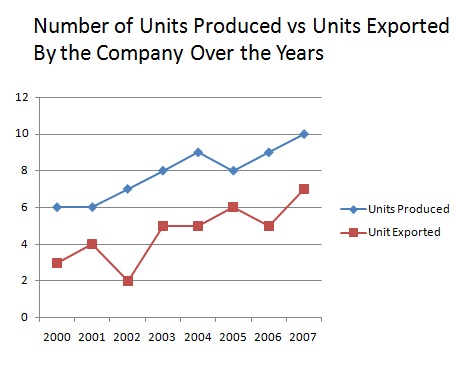
difference between units produced and exported in various years is given by :
2003 = 3 crore,    2001 = 2 crore, 2002 = 5 crore, 2003 = 3 crore, 2004 = 4 crore,
2005 = 2 crore,   2006 = 4 crore, 2007 = 3 crore
Maximum difference is in the year 2002.
說明:仔細研究下圖並回答以下問題
答案 - C
解釋
Percentage of units exported to units produced in various years is given by:
2000 = (3/6*100) % = 50%, 2001 = (4/6*100) %= 66.6%
2002= (2/7*100) % = 28.5%, 2003 = (5/8*100) % = 62.5%
2004 = (5/9*100) % = 55.5%, 2005 = (6/8*100) % = 75%
2006 = (5/9*100) % = 55.5%, 2007 = (7/10*100) % = 70%
So, it is the maximum in the year 2005
說明:仔細研究下圖並回答以下問題
答案 - D
解釋
Required %  in
2002 = {(7-6)/6* 100} % = 16.67%,
2003 = {(8-7)/7*100} % =14.28%,
2004 = {(9-8)/8* 100} % =12.5%,
2006 ={(9-8)/8* 100}% =12.5%
2007 = {(10-9)/9* 100} % =11.1%
∴ It is maximum in the year 2002.
aptitude_line_charts.htm
廣告