- 能力傾向有用資源
- 能力傾向 - 問題 & 答案
能力傾向 - 線形圖
折線圖或線形圖是一種圖表,用於將資訊顯示為一系列稱為“標記”的資料點。這些標記由直線段連線。它在許多領域中是一種非常常用的圖表。通常,測量點按其 x 軸值排序,並用直線段連線。折線圖通常用於視覺化一段時間內的資料趨勢或表示時間序列——按時間順序繪製。
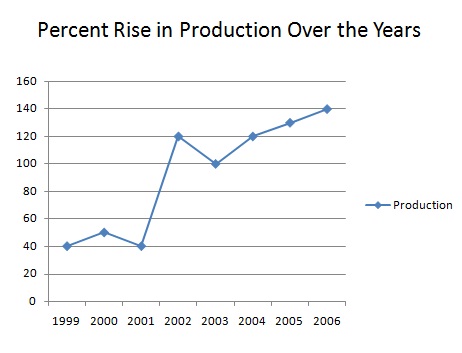
例如,使用上面的圖表,您想檢查在哪一年產量增長百分比最低?
percent rise from the earlier year in
2000 (10/40*100) % = 25%,
2004 (20/100*100) % = 20%
2005 (10/120* 100) % = 8.3%,
2006 (10/130*100) % = 7.7%

∴ In 2006, the percent rise in production was minimum compared to other years.
解答示例
解答示例aptitude_line_charts.htm
廣告