- JavaFX 教程
- JavaFX - 首頁
- JavaFX - 概述
- JavaFX 安裝和架構
- JavaFX - 環境
- JavaFX - 使用 Netbeans 安裝
- JavaFX - 使用 Eclipse 安裝
- JavaFX - 使用 Visual Studio Code 安裝
- JavaFX - 架構
- JavaFX - 應用程式
- JavaFX 二維圖形
- JavaFX - 二維圖形
- JavaFX - 繪製直線
- JavaFX - 繪製矩形
- JavaFX - 繪製圓角矩形
- JavaFX - 繪製圓形
- JavaFX - 繪製橢圓
- JavaFX - 繪製多邊形
- JavaFX - 繪製折線
- JavaFX - 繪製三次貝塞爾曲線
- JavaFX - 繪製二次貝塞爾曲線
- JavaFX - 繪製弧線
- JavaFX - 繪製 SVG 路徑
- JavaFX 二維物件的屬性
- JavaFX - 描邊型別屬性
- JavaFX - 描邊寬度屬性
- JavaFX - 描邊填充屬性
- JavaFX - 描邊屬性
- JavaFX - 描邊連線屬性
- JavaFX - 描邊斜接限制屬性
- JavaFX - 描邊端點屬性
- JavaFX - 平滑屬性
- JavaFX 路徑物件
- JavaFX - 路徑物件
- JavaFX - LineTo 路徑物件
- JavaFX - HLineTo 路徑物件
- JavaFX - VLineTo 路徑物件
- JavaFX - QuadCurveTo 路徑物件
- JavaFX - CubicCurveTo 路徑物件
- JavaFX - ArcTo 路徑物件
- JavaFX 顏色和紋理
- JavaFX - 顏色
- JavaFX - 線性漸變圖案
- JavaFX - 徑向漸變圖案
- JavaFX 文字
- JavaFX - 文字
- JavaFX 效果
- JavaFX - 效果
- JavaFX - 顏色調整效果
- JavaFX - 顏色輸入效果
- JavaFX - 圖片輸入效果
- JavaFX - 混合效果
- JavaFX - 光暈效果
- JavaFX - 輝光效果
- JavaFX - 方框模糊效果
- JavaFX - 高斯模糊效果
- JavaFX - 運動模糊效果
- JavaFX - 反射效果
- JavaFX - 棕褐色效果
- JavaFX - 陰影效果
- JavaFX - 投影陰影效果
- JavaFX - 內陰影效果
- JavaFX - 光照效果
- JavaFX - 遠光源效果
- JavaFX - 聚光燈效果
- JavaFX - 點光源效果
- JavaFX - 位移貼圖
- JavaFX - 透視變換
- JavaFX 動畫
- JavaFX - 動畫
- JavaFX - 旋轉動畫
- JavaFX - 縮放動畫
- JavaFX - 平移動畫
- JavaFX - 淡入淡出動畫
- JavaFX - 填充動畫
- JavaFX - 描邊動畫
- JavaFX - 順序動畫
- JavaFX - 並行動畫
- JavaFX - 暫停動畫
- JavaFX - 路徑動畫
- JavaFX 圖片
- JavaFX - 圖片
- JavaFX 三維圖形
- JavaFX - 三維圖形
- JavaFX - 建立長方體
- JavaFX - 建立圓柱體
- JavaFX - 建立球體
- JavaFX 事件處理
- JavaFX - 事件處理
- JavaFX - 使用便捷方法
- JavaFX - 事件過濾器
- JavaFX - 事件處理器
- JavaFX UI 控制元件
- JavaFX - UI 控制元件
- JavaFX - 列表檢視
- JavaFX - 手風琴
- JavaFX - 按鈕欄
- JavaFX - 選擇框
- JavaFX - HTML 編輯器
- JavaFX - 選單欄
- JavaFX - 分頁
- JavaFX - 進度指示器
- JavaFX - 滾動窗格
- JavaFX - 分隔符
- JavaFX - 滑塊
- JavaFX - 微調器
- JavaFX - 分割窗格
- JavaFX - 表格檢視
- JavaFX - 標籤頁窗格
- JavaFX - 工具欄
- JavaFX - 樹檢視
- JavaFX - 標籤
- JavaFX - 複選框
- JavaFX - 單選按鈕
- JavaFX - 文字欄位
- JavaFX - 密碼欄位
- JavaFX - 檔案選擇器
- JavaFX - 超連結
- JavaFX - 工具提示
- JavaFX - 警報框
- JavaFX - 日期選擇器
- JavaFX - 文字區域
- JavaFX 圖表
- JavaFX - 圖表
- JavaFX - 建立餅圖
- JavaFX - 建立折線圖
- JavaFX - 建立面積圖
- JavaFX - 建立條形圖
- JavaFX - 建立氣泡圖
- JavaFX - 建立散點圖
- JavaFX - 建立堆疊面積圖
- JavaFX - 建立堆疊條形圖
- JavaFX 佈局面板
- JavaFX - 佈局面板
- JavaFX - HBox 佈局
- JavaFX - VBox 佈局
- JavaFX - BorderPane 佈局
- JavaFX - StackPane 佈局
- JavaFX - TextFlow 佈局
- JavaFX - AnchorPane 佈局
- JavaFX - TilePane 佈局
- JavaFX - GridPane 佈局
- JavaFX - FlowPane 佈局
- JavaFX CSS
- JavaFX - CSS
- JavaFX 多媒體
- JavaFX - 處理多媒體
- JavaFX - 播放影片
- JavaFX 有用資源
- JavaFX - 快速指南
- JavaFX - 有用資源
- JavaFX - 討論
JavaFX - 餅圖
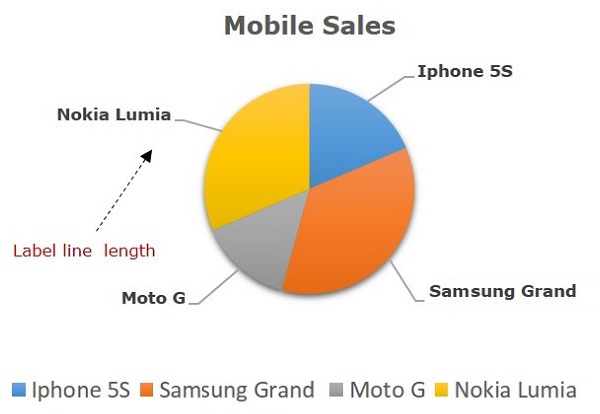
餅圖是用不同顏色表示圓形切片的值的圖表。這些切片帶有標籤,並且圖表中顯示每個切片對應的值。
下面是一個餅圖,它顯示了各個公司在某一時刻的手機銷量。
JavaFX 中的餅圖
在 JavaFX 中,餅圖由名為 **PieChart** 的類表示。此類屬於 **javafx.scene.chart** 包。
透過例項化此類,您可以在 JavaFX 中建立 PieChart 節點。
此類具有 5 個屬性,如下所示:
**clockwise** - 這是一個布林運算子;設定此運算子為 true 時,餅圖中的資料切片將從餅圖的起始角度開始順時針排列。
**data** - 這表示一個 **ObservableList** 物件,它儲存餅圖的資料。
**labelLineLength** - 一個整數運算子,表示連線標籤和餅圖切片的線的長度。
**labelsVisible** - 這是一個布林運算子;設定此運算子為 true 時,將繪製餅圖的標籤。預設情況下,此運算子設定為 true。
**startAngle** - 這是一個雙精度型別運算子,表示第一個餅圖切片的起始角度。
要生成餅圖,請準備一個 ObservableList 物件。準備 **ObservableList** 物件後,將其作為引數傳遞給 **PieChart** 類的建構函式;或者,使用名為 **setData()** 的方法。
生成餅圖的步驟
要在 JavaFX 中生成 **PieChart**,請按照以下步驟操作。
步驟 1:建立類
建立一個 Java 類並繼承 **javafx.application** 包的 **Application** 類,並實現此類的 **start()** 方法,如下所示。
public class ClassName extends Application {
   @Override
   public void start(Stage primaryStage) throws Exception {
   }
}
步驟 2:準備 ObservableList 物件
透過將餅圖的資料作為引數傳遞,準備 **ObservableList** 介面的物件,如下所示:
ObservableList<PieChart.Data> pieChartData = FXCollections.observableArrayList(
   new PieChart.Data("Iphone 5S", 13),
   new PieChart.Data("Samsung Grand", 25),
   new PieChart.Data("MOTO G", 10),
   new PieChart.Data("Nokia Lumia", 22));
步驟 3:建立 PieChart 物件
透過傳遞 **ObservableList** 物件來建立 **PieChart**,如下所示。
//Creating a Pie chart
PieChart pieChart = new PieChart(pieChartData);
步驟 4:設定餅圖的標題
使用 **PieChart** 類的 **setTitle()** 方法設定餅圖的標題。這屬於 **javafx.scene.chart** 包:
//Setting the title of the Pie chart
pieChart.setTitle("Mobile Sales");
步驟 5:設定切片順時針方向
將餅圖的切片設定為順時針方向。這是透過將布林值 true 傳遞給 **PieChart** 類的 **setClockwise()** 方法來完成的。這屬於 **javafx.scene.chart** 包:
//setting the direction to arrange the data
pieChart.setClockwise(true);
步驟 6:設定標籤線的長度
使用 **PieChart** 類的 **setLabelLineLength()** 方法設定標籤線的長度,該方法屬於 **javafx.scene.chart** 包,如下所示:
//Setting the length of the label line
pieChart.setLabelLineLength(50);
步驟 7:設定標籤可見
透過將布林值 **true** 傳遞給 **PieChart** 類的 **setLabelsVisible()** 方法,將餅圖的標籤設定為可見。這屬於 **javafx.scene.chart** 包:
//Setting the labels of the pie chart visible
pieChart.setLabelsVisible(true);
步驟 8:設定餅圖的起始角度
使用 **PieChart** 類的 **setStartAngle()** 方法設定餅圖的起始角度。這屬於 **javafx.scene.chart** 包:
//Setting the start angle of the pie chart
pieChart.setStartAngle(180);
步驟 9:建立 Group 物件
在 **start()** 方法中,透過例項化名為 Group 的類來建立一個 Group 物件。這屬於 **javafx.scene** 包。將前面步驟中建立的 PieChart(節點)物件作為引數傳遞給 Group 類的建構函式。為了將其新增到組中,應按如下方式進行:
Group root = new Group(piechart);
步驟 10:啟動應用程式
最後,請按照以下步驟正確啟動應用程式:
首先,透過將 Group 物件作為引數值傳遞給其建構函式來例項化名為 **Scene** 的類。對於此建構函式,您還可以將應用程式螢幕的尺寸作為可選引數傳遞。
然後,使用 **Stage** 類的 **setTitle()** 方法設定舞臺的標題。
現在,使用名為 **Stage** 的類的 **setScene()** 方法將 Scene 物件新增到舞臺。
使用名為 **show()** 的方法顯示場景的內容。
最後,使用 **launch()** 方法啟動應用程式。
示例
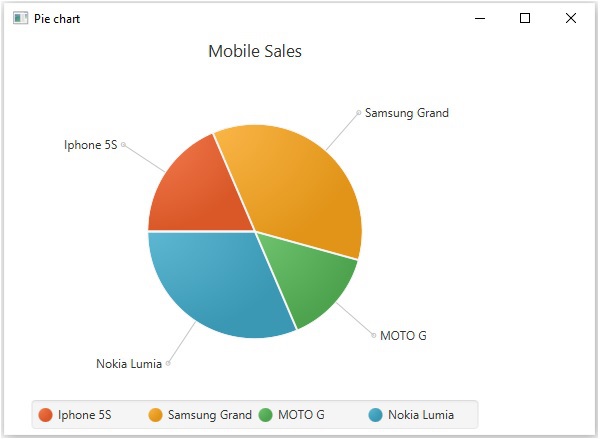
下表用餅圖顯示了手機銷量。下表列出了不同手機品牌及其銷量(每天單位)。
| 序號 | 手機品牌 | 銷量(每天單位) |
|---|---|---|
| 1 | Iphone 5S | 20 |
| 2 | 三星Grand | 20 |
| 3 | 摩托羅拉G | 40 |
| 4 | 諾基亞 Lumia | 10 |
下面是一個使用 JavaFX 生成餅圖的 Java 程式,它描繪了上述資料。將此程式碼儲存到名為PieChartExample.java的檔案中。
import javafx.application.Application;
import javafx.collections.FXCollections;
import javafx.collections.ObservableList;
import javafx.scene.Group;
import javafx.scene.Scene;
import javafx.stage.Stage;
import javafx.scene.chart.PieChart;

public class PieChartExample extends Application {
   @Override
   public void start(Stage stage) {
      //Preparing ObservbleList object
      ObservableList<PieChart.Data> pieChartData = FXCollections.observableArrayList(
         new PieChart.Data("Iphone 5S", 13),
         new PieChart.Data("Samsung Grand", 25),
         new PieChart.Data("MOTO G", 10),
         new PieChart.Data("Nokia Lumia", 22));

      //Creating a Pie chart
      PieChart pieChart = new PieChart(pieChartData);

      //Setting the title of the Pie chart
      pieChart.setTitle("Mobile Sales");

      //setting the direction to arrange the data
      pieChart.setClockwise(true);

      //Setting the length of the label line
      pieChart.setLabelLineLength(50);

      //Setting the labels of the pie chart visible
      pieChart.setLabelsVisible(true);

      //Setting the start angle of the pie chart
      pieChart.setStartAngle(180);

      //Creating a Group object
      Group root = new Group(pieChart);

      //Creating a scene object
      Scene scene = new Scene(root, 600, 400);

      //Setting title to the Stage
      stage.setTitle("Pie chart");

      //Adding scene to the stage
      stage.setScene(scene);

      //Displaying the contents of the stage
      stage.show();
   }
   public static void main(String args[]){
      launch(args);
   }
}
使用以下命令從命令提示符編譯並執行儲存的 java 檔案。
javac --module-path %PATH_TO_FX% --add-modules javafx.controls PieChartExample.java
java --module-path %PATH_TO_FX% --add-modules javafx.controls PieChartExample
輸出
執行上述程式後,會生成一個 JavaFX 視窗,顯示如下所示的餅圖。
示例
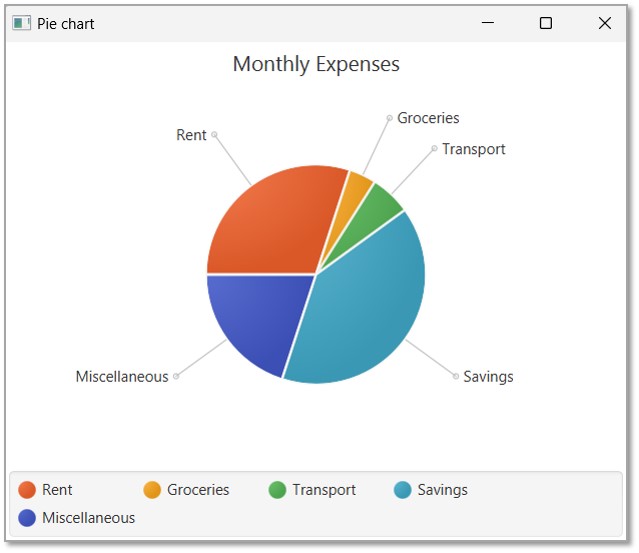
讓我們來看另一個例子,繪製一個 JavaFX 餅圖,來說明一位月薪 25,000 印度盧比的私營僱員的月度支出。將檔案儲存為名為PieChartEmployee.java的檔案。
| 序號 | 必需品 | 支出 |
|---|---|---|
| 1 | 租金 | 7500 |
| 2 | 雜貨 | 1000 |
| 3 | 交通 | 1500 |
| 4 | 儲蓄 | 10000 |
| 5 | 雜項 | 5000 |
 import javafx.application.Application;
import javafx.collections.FXCollections;
import javafx.collections.ObservableList;
import javafx.scene.Group;
import javafx.scene.Scene;
import javafx.stage.Stage;
import javafx.scene.chart.PieChart;

public class PieChartEmployee extends Application {
   @Override
   public void start(Stage stage) {
      //Preparing ObservbleList object
      ObservableList pieChartData = FXCollections.observableArrayList(
         new PieChart.Data("Rent", 7500),
         new PieChart.Data("Groceries", 1000),
         new PieChart.Data("Transport", 1500),
         new PieChart.Data("Savings", 10000),
		 new PieChart.Data("Miscellaneous", 5000));

      //Creating a Pie chart
      PieChart pieChart = new PieChart(pieChartData);

      //Setting the title of the Pie chart
      pieChart.setTitle("Monthly Expenses");

      //setting the direction to arrange the data
      pieChart.setClockwise(true);

      //Setting the length of the label line
      pieChart.setLabelLineLength(50);

      //Setting the labels of the pie chart visible
      pieChart.setLabelsVisible(true);

      //Setting the start angle of the pie chart
      pieChart.setStartAngle(180);

      //Creating a Group object
      Group root = new Group(pieChart);

      //Creating a scene object
      Scene scene = new Scene(root, 600, 400);

      //Setting title to the Stage
      stage.setTitle("Pie chart");

      //Adding scene to the stage
      stage.setScene(scene);

      //Displaying the contents of the stage
      stage.show();
   }
   public static void main(String args[]){
      launch(args);
   }
}
使用以下命令從命令提示符編譯並執行儲存的 java 檔案。
javac --module-path %PATH_TO_FX% --add-modules javafx.controls PieChartEmployee.java
java --module-path %PATH_TO_FX% --add-modules javafx.controls PieChartEmployee
輸出
執行上述程式後,會生成一個 JavaFX 視窗,顯示如下所示的餅圖。