- JavaFX 教程
- JavaFX - 首頁
- JavaFX - 概述
- JavaFX 安裝和架構
- JavaFX - 環境
- JavaFX - 使用 Netbeans 安裝
- JavaFX - 使用 Eclipse 安裝
- JavaFX - 使用 Visual Studio Code 安裝
- JavaFX - 架構
- JavaFX - 應用程式
- JavaFX 2D 形狀
- JavaFX - 2D 形狀
- JavaFX - 繪製線條
- JavaFX - 繪製矩形
- JavaFX - 繪製圓角矩形
- JavaFX - 繪製圓形
- JavaFX - 繪製橢圓
- JavaFX - 繪製多邊形
- JavaFX - 繪製折線
- JavaFX - 繪製三次貝塞爾曲線
- JavaFX - 繪製二次貝塞爾曲線
- JavaFX - 繪製弧線
- JavaFX - 繪製 SVGPath
- JavaFX 2D 物件的屬性
- JavaFX - 描邊型別屬性
- JavaFX - 描邊寬度屬性
- JavaFX - 描邊填充屬性
- JavaFX - 描邊屬性
- JavaFX - 描邊連線屬性
- JavaFX - 描邊斜接限制屬性
- JavaFX - 描邊端點屬性
- JavaFX - 平滑屬性
- JavaFX 路徑物件
- JavaFX - 路徑物件
- JavaFX - LineTo 路徑物件
- JavaFX - HLineTo 路徑物件
- JavaFX - VLineTo 路徑物件
- JavaFX - QuadCurveTo 路徑物件
- JavaFX - CubicCurveTo 路徑物件
- JavaFX - ArcTo 路徑物件
- JavaFX 顏色和紋理
- JavaFX - 顏色
- JavaFX - 線性漸變圖案
- JavaFX - 徑向漸變圖案
- JavaFX 文字
- JavaFX - 文字
- JavaFX 效果
- JavaFX - 效果
- JavaFX - 顏色調整效果
- JavaFX - 顏色輸入效果
- JavaFX - 影像輸入效果
- JavaFX - 混合效果
- JavaFX - 光暈效果
- JavaFX - 輝光效果
- JavaFX - 方框模糊效果
- JavaFX - 高斯模糊效果
- JavaFX - 運動模糊效果
- JavaFX - 反射效果
- JavaFX - 褐色調效果
- JavaFX - 陰影效果
- JavaFX - 投影效果
- JavaFX - 內陰影效果
- JavaFX - 照明效果
- JavaFX - Light.Distant 效果
- JavaFX - Light.Spot 效果
- JavaFX - Point.Spot 效果
- JavaFX - 位移貼圖
- JavaFX - 透視變換
- JavaFX 動畫
- JavaFX - 動畫
- JavaFX - 旋轉過渡
- JavaFX - 縮放過渡
- JavaFX - 平移過渡
- JavaFX - 淡入淡出過渡
- JavaFX - 填充過渡
- JavaFX - 描邊過渡
- JavaFX - 順序過渡
- JavaFX - 並行過渡
- JavaFX - 暫停過渡
- JavaFX - 路徑過渡
- JavaFX 影像
- JavaFX - 影像
- JavaFX 3D 形狀
- JavaFX - 3D 形狀
- JavaFX - 建立長方體
- JavaFX - 建立圓柱體
- JavaFX - 建立球體
- 3D 物件的屬性
- JavaFX - 剔除面屬性
- JavaFX - 繪製模式屬性
- JavaFX - 材質屬性
- JavaFX 事件處理
- JavaFX - 事件處理
- JavaFX - 使用便捷方法
- JavaFX - 事件過濾器
- JavaFX - 事件處理器
- JavaFX UI 控制元件
- JavaFX - UI 控制元件
- JavaFX - ListView
- JavaFX - Accordion
- JavaFX - ButtonBar
- JavaFX - ChoiceBox
- JavaFX - HTMLEditor
- JavaFX - MenuBar
- JavaFX - Pagination
- JavaFX - ProgressIndicator
- JavaFX - ScrollPane
- JavaFX - Separator
- JavaFX - Slider
- JavaFX - Spinner
- JavaFX - SplitPane
- JavaFX - TableView
- JavaFX - TabPane
- JavaFX - ToolBar
- JavaFX - TreeView
- JavaFX - Label
- JavaFX - CheckBox
- JavaFX - RadioButton
- JavaFX - TextField
- JavaFX - PasswordField
- JavaFX - FileChooser
- JavaFX - Hyperlink
- JavaFX - Tooltip
- JavaFX - Alert
- JavaFX - DatePicker
- JavaFX - TextArea
- JavaFX 圖表
- JavaFX - 圖表
- JavaFX - 建立餅圖
- JavaFX - 建立線形圖
- JavaFX - 建立面積圖
- JavaFX - 建立條形圖
- JavaFX - 建立氣泡圖
- JavaFX - 建立散點圖
- JavaFX - 建立堆疊面積圖
- JavaFX - 建立堆疊條形圖
- JavaFX 佈局面板
- JavaFX - 佈局面板
- JavaFX - HBox 佈局
- JavaFX - VBox 佈局
- JavaFX - BorderPane 佈局
- JavaFX - StackPane 佈局
- JavaFX - TextFlow 佈局
- JavaFX - AnchorPane 佈局
- JavaFX - TilePane 佈局
- JavaFX - GridPane 佈局
- JavaFX - FlowPane 佈局
- JavaFX CSS
- JavaFX - CSS
- JavaFX 中的媒體
- JavaFX - 處理媒體
- JavaFX - 播放影片
- JavaFX 有用資源
- JavaFX - 快速指南
- JavaFX - 有用資源
- JavaFX - 討論
JavaFX - 線形圖
線形圖或線圖以一系列資料點(標記)的形式顯示資訊,這些資料點透過直線段連線。線形圖顯示資料在相等的時間頻率下如何變化。
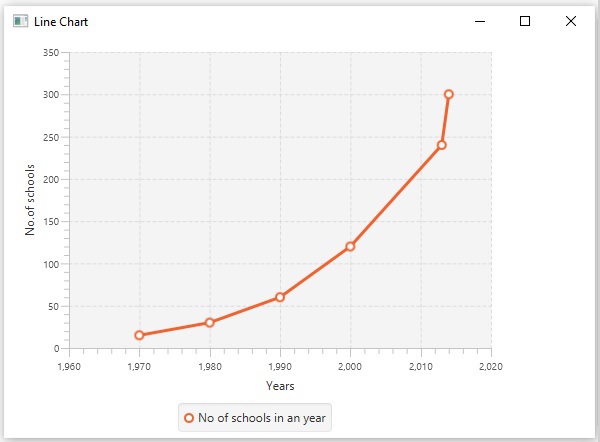
以下是描繪不同年份學校數量的線形圖。

JavaFX 中的線形圖
在 JavaFX 中,線形圖由名為 LineChart 的類表示。此類屬於 javafx.scene.chart 包。透過例項化此類,您可以在 JavaFX 中建立 LineChart 節點。
要在 JavaFX 中生成線形圖,您應該按照以下步驟操作。
步驟 1:定義軸
在 Application 類的 start() 方法中定義線形圖的 X 軸和 Y 軸,併為其設定標籤。在我們的示例中,X 軸表示從 1960 年到 2020 年的年份,每十年有一個主要刻度標記。
public class ClassName extends Application {
   @Override
   public void start(Stage primaryStage) throws Exception {
      //Defining X axis
      NumberAxis xAxis = new NumberAxis(1960, 2020, 10);
      xAxis.setLabel("Years");

      //Defining y axis
      NumberAxis yAxis = new NumberAxis(0, 350, 50);
      yAxis.setLabel("No.of schools");
   }
}
步驟 2:建立線形圖
透過例項化 javafx.scene.chart 包中名為 LineChart 的類來建立線形圖。在該類的建構函式中,傳遞表示在上一步驟中建立的 X 軸和 Y 軸的物件。
LineChart linechart = new LineChart(xAxis, yAxis);
步驟 3:準備資料
例項化 XYChart.Series 類。然後將資料(一系列 x 和 y 座標)新增到此類的 Observable 列表中,如下所示:
XYChart.Series series = new XYChart.Series();
series.setName("No of schools in an year");

series.getData().add(new XYChart.Data(1970, 15));
series.getData().add(new XYChart.Data(1980, 30));
series.getData().add(new XYChart.Data(1990, 60));
series.getData().add(new XYChart.Data(2000, 120));
series.getData().add(new XYChart.Data(2013, 240));
series.getData().add(new XYChart.Data(2014, 300));
步驟 4:將資料新增到線形圖
將上一步驟中準備的資料系列新增到線形圖中,如下所示:
//Setting the data to Line chart
linechart.getData().add(series);
步驟 5:建立 Group 物件
在 start() 方法中,透過例項化名為 Group 的類來建立一個組物件。這屬於 javafx.scene 包。
將上一步驟中建立的 LineChart(節點)物件作為引數傳遞給 Group 類的建構函式。應執行此操作以將其新增到組中,如下所示:
Group root = new Group(linechart);
步驟 6:啟動應用程式
最後,請按照以下步驟正確啟動應用程式:
首先,透過將 Group 物件作為引數值傳遞給其建構函式來例項化名為 Scene 的類。在此建構函式中,您還可以將應用程式螢幕的尺寸作為可選引數傳遞。
然後,使用 Stage 類的 setTitle() 方法為舞臺設定標題。
現在,使用名為 Stage 的類的 setScene() 方法將 Scene 物件新增到舞臺。
使用名為 show() 的方法顯示場景的內容。
最後,藉助 launch() 方法啟動應用程式。
示例
下表顯示了從 1970 年到 2014 年某個地區學校的數量。
| 年份 | 學校數量 |
|---|---|
| 1970 | 15 |
| 1980 | 30 |
| 1990 | 60 |
| 2000 | 120 |
| 2013 | 240 |
| 2014 | 300 |
以下是一個 Java 程式,它使用 JavaFX 生成一個描繪上述資料的線形圖。
將此程式碼儲存在名為 LineChartExample.java 的檔案中。
import javafx.application.Application;
import javafx.scene.Group;
import javafx.scene.Scene;
import javafx.stage.Stage;
import javafx.scene.chart.LineChart;
import javafx.scene.chart.NumberAxis;
import javafx.scene.chart.XYChart;

public class LineChartExample extends Application {
   @Override
   public void start(Stage stage) {
      //Defining the x axis
      NumberAxis xAxis = new NumberAxis(1960, 2020, 10);
      xAxis.setLabel("Years");

      //Defining the y axis
      NumberAxis yAxis = new NumberAxis   (0, 350, 50);
      yAxis.setLabel("No.of schools");

      //Creating the line chart
      LineChart linechart = new LineChart(xAxis, yAxis);

      //Prepare XYChart.Series objects by setting data
      XYChart.Series series = new XYChart.Series();
      series.setName("No of schools in an year");

      series.getData().add(new XYChart.Data(1970, 15));
      series.getData().add(new XYChart.Data(1980, 30));
      series.getData().add(new XYChart.Data(1990, 60));
      series.getData().add(new XYChart.Data(2000, 120));
      series.getData().add(new XYChart.Data(2013, 240));
      series.getData().add(new XYChart.Data(2014, 300));

      //Setting the data to Line chart
      linechart.getData().add(series);

      //Creating a Group object
      Group root = new Group(linechart);

      //Creating a scene object
      Scene scene = new Scene(root, 600, 400);

      //Setting title to the Stage
      stage.setTitle("Line Chart");

      //Adding scene to the stage
      stage.setScene(scene);

      //Displaying the contents of the stage
      stage.show();
   }
   public static void main(String args[]){
      launch(args);
   }
}
使用以下命令從命令提示符編譯並執行儲存的 java 檔案。
javac --module-path %PATH_TO_FX% --add-modules javafx.controls LineChartExample.java
java --module-path %PATH_TO_FX% --add-modules javafx.controls LineChartExample
輸出
執行上述程式後,會生成一個 JavaFX 視窗,其中顯示如下所示的線形圖。
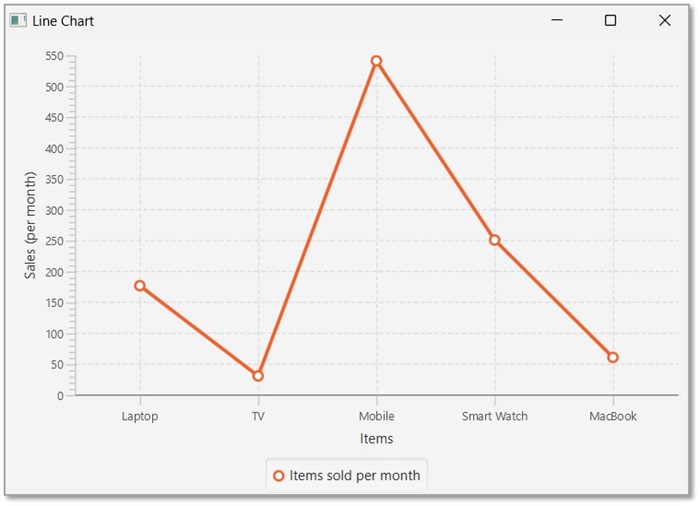
示例
下表說明了每月銷售的電子產品數量。
| 產品 | 銷量(每月) |
|---|---|
| 筆記型電腦 | 176 |
| 電視 | 30 |
| 手機 | 540 |
| 智慧手錶 | 250 |
| MacBook | 60 |
在另一個示例中,使用 JavaFX 生成一個描繪上述資料的線形圖。將此程式碼儲存在名為 LineChartItems.java 的檔案中。
import javafx.application.Application;
import javafx.scene.Group;
import javafx.scene.Scene;
import javafx.stage.Stage;
import javafx.scene.chart.LineChart;
import javafx.scene.chart.NumberAxis;
import javafx.scene.chart.CategoryAxis;
import javafx.scene.chart.XYChart;

public class LineChartItems extends Application {
   @Override
   public void start(Stage stage) {
      //Defining the x axis
      CategoryAxis xAxis = new CategoryAxis();
      xAxis.setLabel("Items");

      //Defining the y axis
      NumberAxis yAxis = new NumberAxis();
      yAxis.setLabel("Sales (per month)");

      //Creating the line chart
      LineChart linechart = new LineChart(xAxis, yAxis);

      //Prepare XYChart.Series objects by setting data
      XYChart.Series series = new XYChart.Series();
      series.setName("Items sold per month");

      series.getData().add(new XYChart.Data("Laptop", 176));
      series.getData().add(new XYChart.Data("TV", 30));
      series.getData().add(new XYChart.Data("Mobile", 540));
      series.getData().add(new XYChart.Data("Smart Watch", 250));
      series.getData().add(new XYChart.Data("MacBook", 60));

      //Creating a scene object
      Scene scene = new Scene(linechart, 600, 400);
	  //Setting the data to Line chart
      linechart.getData().add(series);

      //Setting title to the Stage
      stage.setTitle("Line Chart");

      //Adding scene to the stage
      stage.setScene(scene);

      //Displaying the contents of the stage
      stage.show();
   }
   public static void main(String args[]){
      launch(args);
   }
}
使用以下命令從命令提示符編譯並執行儲存的 java 檔案。
javac --module-path %PATH_TO_FX% --add-modules javafx.controls LineChartItems.java
java --module-path %PATH_TO_FX% --add-modules javafx.controls LineChartItems
輸出
執行上述程式後,會生成一個 JavaFX 視窗,其中顯示如下所示的線形圖。