- JavaFX 教程
- JavaFX - 首頁
- JavaFX - 概述
- JavaFX 安裝和架構
- JavaFX - 環境
- JavaFX - 使用 Netbeans 安裝
- JavaFX - 使用 Eclipse 安裝
- JavaFX - 使用 Visual Studio Code 安裝
- JavaFX - 架構
- JavaFX - 應用
- JavaFX 二維圖形
- JavaFX - 二維圖形
- JavaFX - 繪製直線
- JavaFX - 繪製矩形
- JavaFX - 繪製圓角矩形
- JavaFX - 繪製圓形
- JavaFX - 繪製橢圓
- JavaFX - 繪製多邊形
- JavaFX - 繪製折線
- JavaFX - 繪製三次貝塞爾曲線
- JavaFX - 繪製二次貝塞爾曲線
- JavaFX - 繪製弧形
- JavaFX - 繪製 SVG 路徑
- JavaFX 二維物件的屬性
- JavaFX - 描邊型別屬性
- JavaFX - 描邊寬度屬性
- JavaFX - 描邊填充屬性
- JavaFX - 描邊屬性
- JavaFX - 描邊線連線屬性
- JavaFX - 描邊斜接限制屬性
- JavaFX - 描邊線端點屬性
- JavaFX - 平滑屬性
- JavaFX 路徑物件
- JavaFX - 路徑物件
- JavaFX - LineTo 路徑物件
- JavaFX - HLineTo 路徑物件
- JavaFX - VLineTo 路徑物件
- JavaFX - QuadCurveTo 路徑物件
- JavaFX - CubicCurveTo 路徑物件
- JavaFX - ArcTo 路徑物件
- JavaFX 顏色和紋理
- JavaFX - 顏色
- JavaFX - 線性漸變圖案
- JavaFX - 徑向漸變圖案
- JavaFX 文字
- JavaFX - 文字
- JavaFX 效果
- JavaFX - 效果
- JavaFX - 顏色調整效果
- JavaFX - 顏色輸入效果
- JavaFX - 圖片輸入效果
- JavaFX - 混合效果
- JavaFX - 光暈效果
- JavaFX - 輝光效果
- JavaFX - 方框模糊效果
- JavaFX - 高斯模糊效果
- JavaFX - 運動模糊效果
- JavaFX - 反射效果
- JavaFX - 褐色調效果
- JavaFX - 陰影效果
- JavaFX - 投影陰影效果
- JavaFX - 內陰影效果
- JavaFX - 光照效果
- JavaFX - 遠光源效果
- JavaFX - 聚光燈效果
- JavaFX - 點光源效果
- JavaFX - 位移對映
- JavaFX - 透視變換
- JavaFX 動畫
- JavaFX - 動畫
- JavaFX - 旋轉動畫
- JavaFX - 縮放動畫
- JavaFX - 平移動畫
- JavaFX - 淡入淡出動畫
- JavaFX - 填充動畫
- JavaFX - 描邊動畫
- JavaFX - 順序動畫
- JavaFX - 並行動畫
- JavaFX - 暫停動畫
- JavaFX - 路徑動畫
- JavaFX 圖片
- JavaFX - 圖片
- JavaFX 三維圖形
- JavaFX - 三維圖形
- JavaFX - 建立長方體
- JavaFX - 建立圓柱體
- JavaFX - 建立球體
- JavaFX 事件處理
- JavaFX - 事件處理
- JavaFX - 使用便捷方法
- JavaFX - 事件過濾器
- JavaFX - 事件處理器
- JavaFX UI 控制元件
- JavaFX - UI 控制元件
- JavaFX - 列表檢視
- JavaFX - 手風琴
- JavaFX - 按鈕欄
- JavaFX - 選擇框
- JavaFX - HTML 編輯器
- JavaFX - 選單欄
- JavaFX - 分頁
- JavaFX - 進度指示器
- JavaFX - 滾動窗格
- JavaFX - 分隔符
- JavaFX - 滑塊
- JavaFX - 微調器
- JavaFX - 分割窗格
- JavaFX - 表格檢視
- JavaFX - 標籤頁窗格
- JavaFX - 工具欄
- JavaFX - 樹檢視
- JavaFX - 標籤
- JavaFX - 複選框
- JavaFX - 單選按鈕
- JavaFX - 文字欄位
- JavaFX - 密碼欄位
- JavaFX - 檔案選擇器
- JavaFX - 超連結
- JavaFX - 工具提示
- JavaFX - 警報框
- JavaFX - 日期選擇器
- JavaFX - 文字區域
- JavaFX 圖表
- JavaFX - 圖表
- JavaFX - 建立餅圖
- JavaFX - 建立折線圖
- JavaFX - 建立面積圖
- JavaFX - 建立條形圖
- JavaFX - 建立氣泡圖
- JavaFX - 建立散點圖
- JavaFX - 建立堆疊面積圖
- JavaFX - 建立堆疊條形圖
- JavaFX 佈局面板
- JavaFX - 佈局面板
- JavaFX - HBox 佈局
- JavaFX - VBox 佈局
- JavaFX - BorderPane 佈局
- JavaFX - StackPane 佈局
- JavaFX - TextFlow 佈局
- JavaFX - AnchorPane 佈局
- JavaFX - TilePane 佈局
- JavaFX - GridPane 佈局
- JavaFX - FlowPane 佈局
- JavaFX CSS
- JavaFX - CSS
- JavaFX 多媒體
- JavaFX - 處理多媒體
- JavaFX - 播放影片
- JavaFX 有用資源
- JavaFX - 快速指南
- JavaFX - 有用資源
- JavaFX - 討論
JavaFX - 氣泡圖
氣泡圖用於繪製三維資料;第三維由氣泡的大小(半徑)表示。
下面是一個描繪已完成工作的示例氣泡圖。
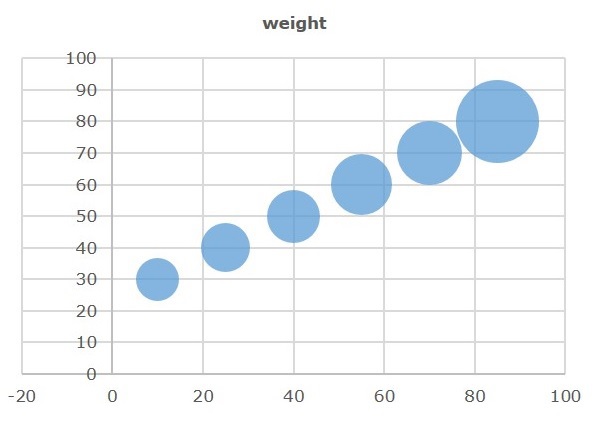
JavaFX 中的氣泡圖
在 JavaFX 中,氣泡圖由名為 BubbleChart 的類表示。此類屬於 javafx.scene.chart 包。透過例項化此類,您可以在 JavaFX 中建立氣泡圖節點。
要在 JavaFX 中生成氣泡圖,請按照以下步驟操作。
步驟 1:定義軸
定義氣泡圖的 X 軸和 Y 軸,併為其設定標籤。在我們的示例中,X 軸代表年齡,Y 軸代表體重。氣泡的半徑代表已完成的工作量。
public class ClassName extends Application {
   @Override
   public void start(Stage primaryStage) throws Exception {
      //Defining the X axis
      NumberAxis xAxis = new NumberAxis(0, 100, 10);
      xAxis.setLabel("Age");

      //Defining Y axis
      NumberAxis yAxis = new NumberAxis(20, 100, 10);
      yAxis.setLabel("Weight");
   }
 }
步驟 2:建立氣泡圖
透過例項化 javafx.scene.chart 包中名為 BubbleChart 的類來建立一個氣泡圖。將表示在先前步驟中建立的 X 軸和 Y 軸的物件傳遞給此類的建構函式。
//Creating the Bubble chart
BubbleChart bubbleChart = new BubbleChart(xAxis, yAxis);
步驟 3:準備資料
例項化 XYChart.Series 類並將資料(一系列 x 和 y 座標)新增到此類的 Observable 列表中,如下所示:
//Prepare XYChart.Series objects by setting data
XYChart.Series series = new XYChart.Series();
series.setName("work");

series.getData().add(new XYChart.Data(10,30,4));
series.getData().add(new XYChart.Data(25,40,5));
series.getData().add(new XYChart.Data(40,50,9));
series.getData().add(new XYChart.Data(55,60,7));
series.getData().add(new XYChart.Data(70,70,9));
series.getData().add(new XYChart.Data(85,80,6));
步驟 4:將資料新增到氣泡圖
將上一步中準備的資料系列新增到氣泡圖中,如下所示:
//Setting the data to bar chart
bubbleChart.getData().add(series);
步驟 5:建立 Group 物件
在 start() 方法中,透過例項化名為 Group 的類來建立一個 Group 物件。這屬於 javafx.scene 包。
將上一步中建立的氣泡圖(節點)物件作為引數傳遞給 Group 類的建構函式。這應該按如下方式完成,以便將其新增到組中:
Group root = new Group(bubbleChart);
步驟 6:啟動應用程式
最後,按照以下步驟正確啟動應用程式:
首先,透過將 Group 物件作為引數值傳遞給其建構函式來例項化名為 Scene 的類。您可以將應用程式螢幕的尺寸作為可選引數傳遞給此建構函式。
然後,使用 Stage 類的 setTitle() 方法設定舞臺的標題。
現在,使用名為 Stage 的類的 setScene() 方法將 Scene 物件新增到舞臺。
使用名為 show() 的方法顯示場景的內容。
最後,使用 launch() 方法啟動應用程式。
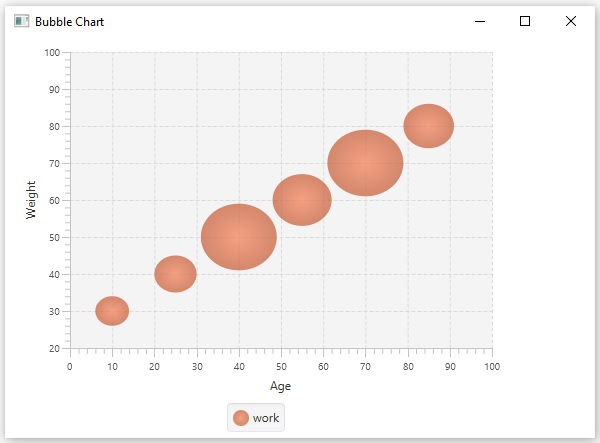
示例
讓我們考慮不同的個體及其年齡、體重和工作能力。工作能力可以視為工作小時數,在圖表中繪製為氣泡。
| 體重 | ||||||||
|---|---|---|---|---|---|---|---|---|
| 年齡 | ||||||||
| 30 | 40 | 50 | 60 | 70 | 80 | |||
| 10 | 4 | 工作量 | ||||||
| 25 | 5 | |||||||
| 40 | 6 | |||||||
| 55 | 8 | |||||||
| 70 | 9 | |||||||
| 85 | 15 | |||||||
以下是一個 Java 程式,它使用 JavaFX 生成一個氣泡圖,描繪了上述資料。
將此程式碼儲存在名為 BubbleChartExample.java 的檔案中。
import javafx.application.Application;
import javafx.scene.Group;
import javafx.scene.Scene;
import javafx.scene.chart.BubbleChart;
import javafx.stage.Stage;
import javafx.scene.chart.NumberAxis;
import javafx.scene.chart.XYChart;

public class BubbleChartExample extends Application {
   @Override
   public void start(Stage stage) {
      //Defining the axes
      NumberAxis xAxis = new NumberAxis(0, 100, 10);
      xAxis.setLabel("Age");

      NumberAxis yAxis = new NumberAxis(20, 100, 10);
      yAxis.setLabel("Weight");

      //Creating the Bubble chart
      BubbleChart bubbleChart = new BubbleChart(xAxis, yAxis);

      //Prepare XYChart.Series objects by setting data
      XYChart.Series series = new XYChart.Series();
      series.setName("work");

      series.getData().add(new XYChart.Data(10,30,4));
      series.getData().add(new XYChart.Data(25,40,5));
      series.getData().add(new XYChart.Data(40,50,9));
      series.getData().add(new XYChart.Data(55,60,7));
      series.getData().add(new XYChart.Data(70,70,9));
      series.getData().add(new XYChart.Data(85,80,6));

      //Setting the data to bar chart
      bubbleChart.getData().add(series);

      //Creating a Group object
      Group root = new Group(bubbleChart);

      //Creating a scene object
      Scene scene = new Scene(root, 600, 400);

      //Setting title to the Stage
      stage.setTitle("Bubble Chart");

      //Adding scene to the stage
      stage.setScene(scene);

      //Displaying the contents of the stage
      stage.show();
   }
   public static void main(String args[]){
      launch(args);
   }
}
使用以下命令從命令提示符編譯並執行儲存的 Java 檔案。
javac --module-path %PATH_TO_FX% --add-modules javafx.controls BubbleChartExample.java
java --module-path %PATH_TO_FX% --add-modules javafx.controls BubbleChartExample
輸出
執行上述程式後,將生成一個 JavaFX 視窗,顯示如下所示的氣泡圖。
示例
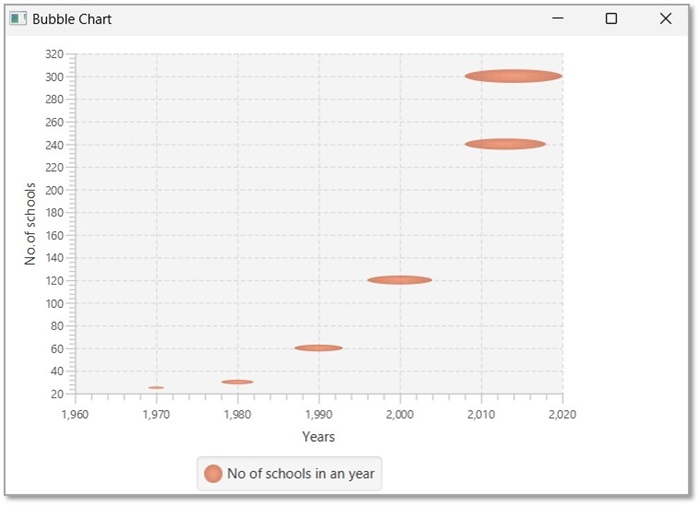
下表顯示了 1970 年至 2014 年某地區學校的數量。
| 年份 | 學校數量 |
|---|---|
| 1970 | 15 |
| 1980 | 30 |
| 1990 | 60 |
| 2000 | 120 |
| 2013 | 240 |
| 2014 | 300 |
以下是一個 Java 程式,它使用 JavaFX 生成一個氣泡圖,描繪了上述資料。
將此程式碼儲存在名為 BubbleChartSchools.java 的檔案中。
import javafx.application.Application;
import javafx.scene.Group;
import javafx.scene.Scene;
import javafx.stage.Stage;
import javafx.scene.chart.BubbleChart;
import javafx.scene.chart.NumberAxis;
import javafx.scene.chart.XYChart;

public class BubbleChartSchools extends Application {
   @Override
   public void start(Stage stage) {
      //Defining the x axis
      NumberAxis xAxis = new NumberAxis(1960, 2020, 10);
      xAxis.setLabel("Years");

      //Defining the y axis
      NumberAxis yAxis = new NumberAxis(20, 320, 20);
      yAxis.setLabel("No.of schools");

      //Creating the Bubble chart
      BubbleChart bubblechart = new BubbleChart(xAxis, yAxis);

      //Prepare XYChart.Series objects by setting data
      XYChart.Series series = new XYChart.Series();
      series.setName("No of schools in an year");
      // Add a third coordinate representing the radius of bubble
      series.getData().add(new XYChart.Data(1970, 25, 1));
      series.getData().add(new XYChart.Data(1980, 30, 2));
      series.getData().add(new XYChart.Data(1990, 60, 3));
      series.getData().add(new XYChart.Data(2000, 120, 4));
      series.getData().add(new XYChart.Data(2013, 240, 5));
      series.getData().add(new XYChart.Data(2014, 300, 6));

      //Setting the data to bubble chart
      bubblechart.getData().add(series);

      //Creating a Group object
      Group root = new Group(bubblechart);

      //Creating a scene object
      Scene scene = new Scene(root, 600, 400);

      //Setting title to the Stage
      stage.setTitle("Bubble Chart");

      //Adding scene to the stage
      stage.setScene(scene);

      //Displaying the contents of the stage
      stage.show();
   }
   public static void main(String args[]){
      launch(args);
   }
}
使用以下命令從命令提示符編譯並執行儲存的 Java 檔案。
javac --module-path %PATH_TO_FX% --add-modules javafx.controls BubbleChartSchools.java
java --module-path %PATH_TO_FX% --add-modules javafx.controls BubbleChartSchools
輸出
執行上述程式後,將生成一個 JavaFX 視窗,顯示如下所示的氣泡圖。