- Mahotas 教程
- Mahotas - 首頁
- Mahotas - 簡介
- Mahotas - 計算機視覺
- Mahotas - 歷史
- Mahotas - 特性
- Mahotas - 安裝
- Mahotas 處理影像
- Mahotas - 處理影像
- Mahotas - 載入影像
- Mahotas - 載入灰度影像
- Mahotas - 顯示影像
- Mahotas - 顯示影像形狀
- Mahotas - 儲存影像
- Mahotas - 影像的質心
- Mahotas - 影像卷積
- Mahotas - 建立 RGB 影像
- Mahotas - 影像的尤拉數
- Mahotas - 影像中零的比例
- Mahotas - 獲取影像矩
- Mahotas - 影像中的區域性最大值
- Mahotas - 影像橢圓軸
- Mahotas - 影像拉伸 RGB
- Mahotas 顏色空間轉換
- Mahotas - 顏色空間轉換
- Mahotas - RGB 轉灰度
- Mahotas - RGB 轉 LAB
- Mahotas - RGB 轉褐色
- Mahotas - RGB 轉 XYZ
- Mahotas - XYZ 轉 LAB
- Mahotas - XYZ 轉 RGB
- Mahotas - 增加伽馬校正
- Mahotas - 拉伸伽馬校正
- Mahotas 標記影像函式
- Mahotas - 標記影像函式
- Mahotas - 標記影像
- Mahotas - 過濾區域
- Mahotas - 邊界畫素
- Mahotas - 形態學運算
- Mahotas - 形態學運算元
- Mahotas - 查詢影像均值
- Mahotas - 裁剪影像
- Mahotas - 影像的偏心率
- Mahotas - 疊加影像
- Mahotas - 影像的圓度
- Mahotas - 調整影像大小
- Mahotas - 影像的直方圖
- Mahotas - 膨脹影像
- Mahotas - 腐蝕影像
- Mahotas - 分水嶺
- Mahotas - 影像開運算
- Mahotas - 影像閉運算
- Mahotas - 填充影像孔洞
- Mahotas - 條件膨脹影像
- Mahotas - 條件腐蝕影像
- Mahotas - 影像條件分水嶺
- Mahotas - 影像中的區域性最小值
- Mahotas - 影像的區域最大值
- Mahotas - 影像的區域最小值
- Mahotas - 高階概念
- Mahotas - 影像閾值化
- Mahotas - 設定閾值
- Mahotas - 軟閾值
- Mahotas - Bernsen 區域性閾值化
- Mahotas - 小波變換
- 製作影像小波中心
- Mahotas - 距離變換
- Mahotas - 多邊形實用程式
- Mahotas - 區域性二值模式
- 閾值鄰域統計
- Mahotas - Haralic 特徵
- 標記區域的權重
- Mahotas - Zernike 特徵
- Mahotas - Zernike 矩
- Mahotas - 排序濾波器
- Mahotas - 2D 拉普拉斯濾波器
- Mahotas - 多數濾波器
- Mahotas - 均值濾波器
- Mahotas - 中值濾波器
- Mahotas - Otsu 方法
- Mahotas - 高斯濾波
- Mahotas - 擊中擊不中變換
- Mahotas - 標記最大陣列
- Mahotas - 影像的平均值
- Mahotas - SURF 密集點
- Mahotas - SURF 積分
- Mahotas - Haar 變換
- 突出顯示影像最大值
- 計算線性二值模式
- 獲取標籤的邊界
- 反轉 Haar 變換
- Riddler-Calvard 方法
- 標記區域的大小
- Mahotas - 模板匹配
- 加速魯棒特徵
- 刪除帶邊框的標記
- Mahotas - Daubechies 小波
- Mahotas - Sobel 邊緣檢測
Mahotas - RGB 轉灰度
影像處理中的 RGB 到灰度轉換將 RGB 顏色空間中的彩色影像轉換為灰度影像。
- RGB 影像由三個顏色通道組成——紅色、綠色和藍色。RGB 影像中的每個畫素都由這三個通道的強度值的組合表示,從而產生廣泛的顏色範圍。
- 另一方面,灰度影像是單通道影像(僅包含(灰色)的陰影),其中每個畫素表示原始影像中相應位置的強度。
- 強度值範圍從黑色(0)到白色(255),中間是灰色的陰影。
Mahotas 中的 RGB 轉灰度轉換
在 Mahotas 中,我們可以使用 **colors.rgb2gray()** 函式將 RGB 影像轉換為灰度影像。
該函式根據其 RGB 值的加權平均值計算每個畫素的灰度強度。
權重反映了人類對顏色的感知,紅色權重最高,其次是綠色,然後是藍色。
mahotas.colors.rgb2gray() 函式
mahotas.colors.rgb2gray() 函式以 RGB 影像作為輸入,並返回影像的灰度版本。
生成的灰度影像保留了原始 RGB 影像的結構和整體內容,但缺少顏色資訊。
語法
以下是 mahotas 中 rgb2gray() 函式的基本語法:
mahotas.colors.rgb2gray(rgb_image, dtype=float)
其中,
**rgb_image** - 它是 RGB 顏色空間中的輸入影像。
**dtype(可選)** - 它是返回影像的資料型別(預設為浮點數)。
示例
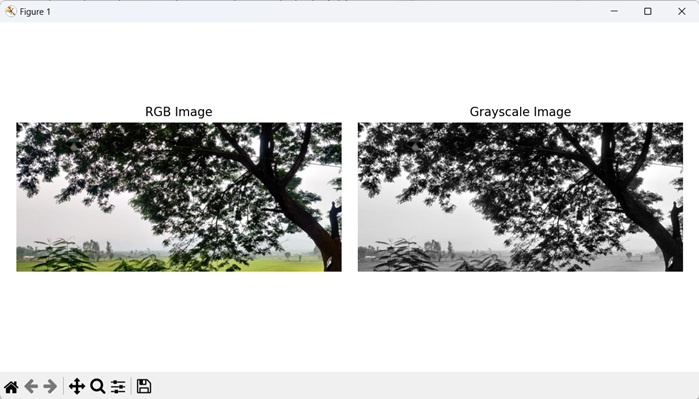
在以下示例中,我們使用 mh.colors.rgb2gray() 函式將 RGB 影像轉換為灰度影像:
import mahotas as mh
import numpy as np
import matplotlib.pyplot as mtplt
# Loading the image
image = mh.imread('nature.jpeg')
# Converting it to grayscale
gray_image = mh.colors.rgb2gray(image)
# Creating a figure and axes for subplots
fig, axes = mtplt.subplots(1, 2)
# Displaying the original RGB image
axes[0].imshow(image)
axes[0].set_title('RGB Image')
axes[0].set_axis_off()
# Displaying the grayscale image
axes[1].imshow(gray_image, cmap='gray')
axes[1].set_title('Grayscale Image')
axes[1].set_axis_off()
# Adjusting spacing between subplots
mtplt.tight_layout()
# Showing the figures
mtplt.show()
輸出
以下是上述程式碼的輸出:
使用 RGB 通道的平均值
我們還可以使用 RGB 通道的平均值將 RGB 影像轉換為灰度影像。
將每個畫素的紅色、綠色和藍色的強度相加併除以三,即可獲得平均強度值。我們可以使用 numpy 庫的 mean() 函式實現這一點。
生成的影像將是灰度影像,具有單個通道,其中每個畫素表示跨 RGB 通道的平均強度,其中每個顏色通道對整體灰度強度都有同等貢獻。
示例
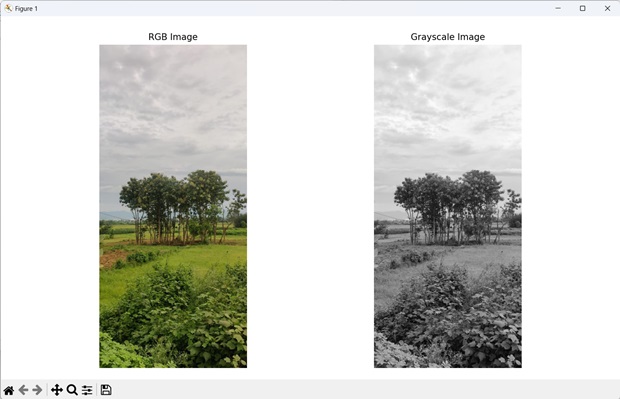
以下示例顯示了使用 RGB 通道平均值將 RGB 影像轉換為灰度的過程:
import mahotas as mh
import numpy as np
import matplotlib.pyplot as mtplt
# Loading the image
image = mh.imread('sun.png')
# Converting it to grayscale
gray_image = np.mean(image, axis=2).astype(np.uint8)
# Creating a figure and axes for subplots
fig, axes = mtplt.subplots(1, 2)
# Displaying the original RGB image
axes[0].imshow(image)
axes[0].set_title('RGB Image')
axes[0].set_axis_off()
# Displaying the grayscale image
axes[1].imshow(gray_image, cmap='gray')
axes[1].set_title('Grayscale Image')
axes[1].set_axis_off()
# Adjusting spacing between subplots
mtplt.tight_layout()
# Showing the figures
mtplt.show()
輸出
上述程式碼的輸出如下:
使用亮度
亮度是指物件或影像的感知亮度或亮度。
在影像處理中,亮度為每個畫素的紅色、綠色和藍色顏色通道分配特定的權重,並將它們組合起來計算灰度強度值。
RGB 顏色空間中的亮度可以使用以下公式計算:
Luminosity = 0.2989 * R + 0.5870 * G + 0.1140 * B
其中,值 **0.2989、0.5870** 和 **0.1140** 分別是分配給紅色、綠色和藍色通道的權重。這些權重來自用於數字顯示的標準 Rec.709 顏色空間。
與簡單地平均 RGB 通道相比,此方法可產生更好的結果,因為它可以更好地捕捉原始影像的視覺感知。
示例
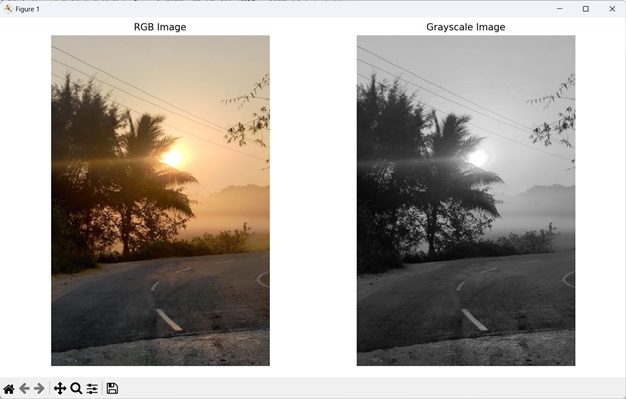
在這裡,我們定義了 RGB 的亮度,以將彩色影像轉換為其等效的灰度影像:
import mahotas as mh
import numpy as np
import matplotlib.pyplot as mtplt
# Loading the image
image = mh.imread('tree.tiff')
# Converting it to gray
gray_image = np.dot(image[..., :3], [0.2989, 0.5870, 0.1140]).astype(np.uint8)
# Creating a figure and axes for subplots
fig, axes = mtplt.subplots(1, 2)
# Displaying the original RGB image
axes[0].imshow(image)
axes[0].set_title('RGB Image')
axes[0].set_axis_off()
# Displaying the grayscale image
axes[1].imshow(gray_image, cmap='gray')
axes[1].set_title('Grayscale Image')
axes[1].set_axis_off()
# Adjusting spacing between subplots
mtplt.tight_layout()
# Showing the figures
mtplt.show()
輸出
執行上述程式碼後,我們將獲得以下輸出: