- Mahotas 教程
- Mahotas - 首頁
- Mahotas - 簡介
- Mahotas - 計算機視覺
- Mahotas - 歷史
- Mahotas - 特性
- Mahotas - 安裝
- Mahotas 影像處理
- Mahotas - 影像處理
- Mahotas - 載入影像
- Mahotas - 載入灰度影像
- Mahotas - 顯示影像
- Mahotas - 顯示影像形狀
- Mahotas - 儲存影像
- Mahotas - 影像質心
- Mahotas - 影像卷積
- Mahotas - 建立RGB影像
- Mahotas - 影像尤拉數
- Mahotas - 影像中零的比例
- Mahotas - 獲取影像矩
- Mahotas - 影像區域性最大值
- Mahotas - 影像橢圓軸
- Mahotas - 影像RGB拉伸
- Mahotas 顏色空間轉換
- Mahotas - 顏色空間轉換
- Mahotas - RGB到灰度轉換
- Mahotas - RGB到LAB轉換
- Mahotas - RGB到褐色轉換
- Mahotas - RGB到XYZ轉換
- Mahotas - XYZ到LAB轉換
- Mahotas - XYZ到RGB轉換
- Mahotas - 增加伽馬校正
- Mahotas - 拉伸伽馬校正
- Mahotas 標記影像函式
- Mahotas - 標記影像函式
- Mahotas - 標記影像
- Mahotas - 過濾區域
- Mahotas - 邊界畫素
- Mahotas - 形態學運算
- Mahotas - 形態學運算元
- Mahotas - 求影像平均值
- Mahotas - 裁剪影像
- Mahotas - 影像離心率
- Mahotas - 影像疊加
- Mahotas - 影像圓度
- Mahotas - 調整影像大小
- Mahotas - 影像直方圖
- Mahotas - 膨脹影像
- Mahotas - 腐蝕影像
- Mahotas - 分水嶺演算法
- Mahotas - 影像開運算
- Mahotas - 影像閉運算
- Mahotas - 填充影像空洞
- Mahotas - 條件膨脹影像
- Mahotas - 條件腐蝕影像
- Mahotas - 影像條件分水嶺演算法
- Mahotas - 影像區域性最小值
- Mahotas - 影像區域最大值
- Mahotas - 影像區域最小值
- Mahotas - 高階概念
- Mahotas - 影像閾值化
- Mahotas - 設定閾值
- Mahotas - 軟閾值
- Mahotas - Bernsen區域性閾值化
- Mahotas - 小波變換
- 製作影像小波中心
- Mahotas - 距離變換
- Mahotas - 多邊形工具
- Mahotas - 區域性二值模式
- 閾值鄰域統計
- Mahotas - Haralic 特徵
- 標記區域的權重
- Mahotas - Zernike 特徵
- Mahotas - Zernike 矩
- Mahotas - 排序濾波器
- Mahotas - 二維拉普拉斯濾波器
- Mahotas - 多數濾波器
- Mahotas - 均值濾波器
- Mahotas - 中值濾波器
- Mahotas - Otsu 方法
- Mahotas - 高斯濾波
- Mahotas - Hit & Miss 變換
- Mahotas - 標記最大值陣列
- Mahotas - 影像平均值
- Mahotas - SURF 密集點
- Mahotas - SURF 積分影像
- Mahotas - Haar 變換
- 突出影像最大值
- 計算線性二值模式
- 獲取標記的邊界
- 反轉 Haar 變換
- Riddler-Calvard 方法
- 標記區域的大小
- Mahotas - 模板匹配
- 加速魯棒特徵
- 去除邊界標記
- Mahotas - Daubechies 小波
- Mahotas - Sobel 邊緣檢測
Mahotas - 標記最大值陣列
標記最大值陣列指的是一個數組,它儲存 標記影像 中每個區域的最大強度值。為了找到一個區域的最大強度值,需要檢查該區域中的每個畫素。然後,選擇最亮畫素的強度值作為最大強度值。簡單來說,標記最大值陣列用於查詢影像中最亮的區域。
例如,假設我們有一個包含三個畫素的區域。這三個畫素的強度值分別為0.5、0.2和0.8。那麼該區域的最大強度值將為0.8。
Mahotas中的標記最大值陣列
在Mahotas中,我們可以使用mahotas.labeled.labeled_max()函式來建立一個標記最大值陣列。該函式迭代地搜尋區域中最亮的畫素。然後,它將最亮畫素的強度值儲存在一個數組中。
生成的陣列是一個標記最大值陣列,包含影像每個區域的最大強度值。
mahotas.labeled.labeled_max()函式
mahotas.labeled.labeled_max()函式接受影像和標記影像作為輸入。它返回一個數組,其中包含每個標記區域的最大強度值。
語法
以下是Mahotas中labeled_max()函式的基本語法:
mahotas.labeled.labeled_max(array, labeled, minlength=None)
其中,
array - 輸入影像。
labeled - 標記影像。
minlength (可選) - 指定輸出陣列中要包含的最小區域數(預設為None)。
示例
在下面的示例中,我們使用labeled_max()函式在標記影像中查詢標記最大值陣列。
import mahotas as mh
import numpy as np
import matplotlib.pyplot as mtplt
# Loading the images
image = mh.imread('sea.bmp')
# Converting it to grayscale
image = mh.colors.rgb2gray(image).astype(np.uint8)
# Applying thresholding
threshold = mh.thresholding.rc(image)
threshold_image = image > threshold
# Labeling the image
label, num_objects = mh.label(threshold_image)
# Getting the labeled max array
labeled_max = mh.labeled.labeled_max(image, label)
# Printing the labeled max array
print('Labeled max array:', labeled_max)
# Creating a figure and axes for subplots
fig, axes = mtplt.subplots(1, 2)
# Displaying the original image
axes[0].imshow(image, cmap='gray')
axes[0].set_title('Original Image')
axes[0].set_axis_off()
# Displaying the labeled image
axes[1].imshow(label, cmap='gray')
axes[1].set_title('Labeled Image')
axes[1].set_axis_off()
# Adjusting spacing between subplots
mtplt.tight_layout()
# Showing the figures
mtplt.show()
輸出
以下是上述程式碼的輸出:
Labeled max array: [107 111 129 ... 141 119 109]
獲得的影像是:

隨機布林影像的標記最大值陣列
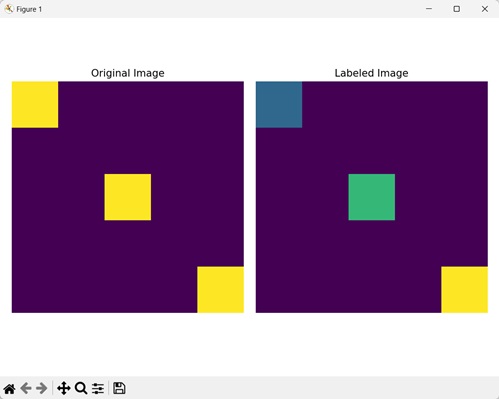
我們還可以找到隨機布林影像的標記最大值陣列。隨機布林影像指的是每個畫素的值為0或1的影像。“1”表示前景畫素,“0”表示背景畫素。
在Mahotas中,要查詢隨機布林影像的標記最大值陣列,我們首先需要使用np.zeros()函式生成特定大小的隨機布林影像。
此影像最初僅包含背景畫素。然後,我們將整數值分配給影像的幾個部分以建立不同的區域。
然後,我們使用labeled_max()函式查詢影像的標記最大值陣列。
示例
在下面提到的示例中,我們正在查詢隨機布林影像的標記最大值陣列。
import mahotas as mh
import numpy as np
import matplotlib.pyplot as mtplt
# Creating a random image
image = np.zeros((10, 10), bool)
# Assigning values to the regions
image[:2, :2] = 1
image[4:6, 4:6] = 1
image[8:, 8:] = 1
# Labeling the image
label, num_objects = mh.label(image)
# Random sampling
random_sample = np.random.random_sample(image.shape)
# Getting the labeled max array
labeled_max = mh.labeled.labeled_max(random_sample, label)
# Printing the labeled max array
print('Labeled max array')
for i, intensity in enumerate(labeled_max):
   print('Region', i, ':', intensity)
# Creating a figure and axes for subplots
fig, axes = mtplt.subplots(1, 2)
# Displaying the original image
axes[0].imshow(image)
axes[0].set_title('Original Image')
axes[0].set_axis_off()
# Displaying the labeled image
axes[1].imshow(label)
axes[1].set_title('Labeled Image')
axes[1].set_axis_off()
# Adjusting spacing between subplots
mtplt.tight_layout()
# Showing the figures
mtplt.show()
輸出
上述程式碼的輸出如下:
Labeled max array
Region 0 : 0.9950607583625318
Region 1 : 0.8626363785944107
Region 2 : 0.6343883551171169
Region 3 : 0.8162320509314726
我們得到以下輸出影像: