- Mahotas教程
- Mahotas - 首頁
- Mahotas - 簡介
- Mahotas - 計算機視覺
- Mahotas - 歷史
- Mahotas - 特性
- Mahotas - 安裝
- Mahotas影像處理
- Mahotas - 影像處理
- Mahotas - 載入影像
- Mahotas - 載入灰度影像
- Mahotas - 顯示影像
- Mahotas - 顯示影像形狀
- Mahotas - 儲存影像
- Mahotas - 影像質心
- Mahotas - 影像卷積
- Mahotas - 建立RGB影像
- Mahotas - 影像尤拉數
- Mahotas - 影像中零值的比例
- Mahotas - 獲取影像矩
- Mahotas - 影像區域性最大值
- Mahotas - 影像橢圓軸
- Mahotas - RGB影像拉伸
- Mahotas顏色空間轉換
- Mahotas - 顏色空間轉換
- Mahotas - RGB轉灰度
- Mahotas - RGB轉LAB
- Mahotas - RGB轉棕褐色
- Mahotas - RGB轉XYZ
- Mahotas - XYZ轉LAB
- Mahotas - XYZ轉RGB
- Mahotas - 增加伽馬校正
- Mahotas - 拉伸伽馬校正
- Mahotas標記影像函式
- Mahotas - 標記影像函式
- Mahotas - 標記影像
- Mahotas - 過濾區域
- Mahotas - 邊界畫素
- Mahotas - 形態學操作
- Mahotas - 形態學運算元
- Mahotas - 查詢影像平均值
- Mahotas - 裁剪影像
- Mahotas - 影像離心率
- Mahotas - 影像疊加
- Mahotas - 影像圓度
- Mahotas - 調整影像大小
- Mahotas - 影像直方圖
- Mahotas - 影像膨脹
- Mahotas - 影像腐蝕
- Mahotas - 分水嶺演算法
- Mahotas - 影像開運算
- Mahotas - 影像閉運算
- Mahotas - 填充影像孔洞
- Mahotas - 條件膨脹影像
- Mahotas - 條件腐蝕影像
- Mahotas - 影像條件分水嶺
- Mahotas - 影像區域性最小值
- Mahotas - 影像區域最大值
- Mahotas - 影像區域最小值
- Mahotas - 高階概念
- Mahotas - 影像閾值化
- Mahotas - 設定閾值
- Mahotas - 軟閾值
- Mahotas - Bernsen區域性閾值化
- Mahotas - 小波變換
- 建立影像小波中心
- Mahotas - 距離變換
- Mahotas - 多邊形工具
- Mahotas - 區域性二值模式
- 閾值鄰域統計
- Mahotas - Haralick特徵
- 標記區域的權重
- Mahotas - Zernike特徵
- Mahotas - Zernike矩
- Mahotas - 排序濾波器
- Mahotas - 二維拉普拉斯濾波器
- Mahotas - 多數濾波器
- Mahotas - 均值濾波器
- Mahotas - 中值濾波器
- Mahotas - Otsu方法
- Mahotas - 高斯濾波
- Mahotas - 擊中擊不中變換
- Mahotas - 標記最大陣列
- Mahotas - 影像平均值
- Mahotas - SURF密集點
- Mahotas - SURF積分
- Mahotas - Haar變換
- 突出顯示影像最大值
- 計算線性二值模式
- 獲取標籤邊界
- 反轉Haar變換
- Riddler-Calvard方法
- 標記區域的大小
- Mahotas - 模板匹配
- 加速魯棒特徵
- 移除帶邊框的標籤
- Mahotas - Daubechies小波
- Mahotas - Sobel邊緣檢測
Mahotas - RGB影像拉伸
影像拉伸是一種透過將原始畫素值對映到新的值範圍來增強影像對比度的技術。這通常是為了提高細節的可視性並增強影像的整體外觀。
對於RGB影像,每個畫素都有三個顏色通道——紅色、綠色和藍色。拉伸RGB影像涉及獨立地拉伸每個顏色通道的值以擴充套件強度範圍。
Mahotas中的RGB影像拉伸
在Mahotas中,RGB影像拉伸是透過拉伸影像的各個顏色通道(紅色、綠色和藍色)來執行的。拉伸過程涉及將原始畫素強度對映到新的範圍以增加對比度。
拉伸各個RGB通道後,需要將它們組合起來以建立最終的拉伸影像。
我們可以使用stretch()函式和stretch_rgb()函式在mahotas中執行RGB影像拉伸。
使用stretch()和stretch_rgb()函式
mahotas.stretch()和mahotas.stretch_rgb()函式將RGB影像每個通道中的畫素值拉伸到指定的min_value和max_value之間。
值低於min_value的畫素將設定為min_value,而值高於max_value的畫素將設定為max_value。拉伸在每個通道上獨立執行。
語法
以下是mahotas.stretch()函式的基本語法:
mahotas.stretch(img,arg0=None, arg1=None, dtype=<type 'numpy.uint8'>)
以下是mahotas.stretch_rgb()函式的基本語法:
mahotas.stretch(img,arg0=None, arg1=None, dtype=<type 'numpy.uint8'>)
引數
以下是傳遞給mahotas.stretch()函式的引數:
img - 輸入影像。
arg0和arg1(可選) - 這些引數指定畫素值應拉伸到的範圍。這些引數的解釋取決於它們的值:
如果arg0和arg1都提供且不為None,則它們分別表示畫素值應拉伸到的最小值和最大值。低於arg0的畫素值將設定為arg0,高於arg1的畫素值將設定為arg1。
如果僅提供arg0且arg1為None,則arg0應為長度為2的元組或列表,表示百分位數值。低於arg0第一個元素的值的畫素值將設定為該值,高於arg0第二個元素的值的畫素值將設定為該值。
如果arg0和arg1都為None,則畫素值將拉伸到由dtype引數指定的資料型別的完整範圍(預設值為numpy.uint8)。
dtype - 指定輸出影像的資料型別。預設值為numpy.uint8,表示無符號8位整數。
示例
在以下示例中,我們使用mahotas.stretch()函式來拉伸影像:
import mahotas as mh
import numpy as np
import matplotlib.pyplot as plt
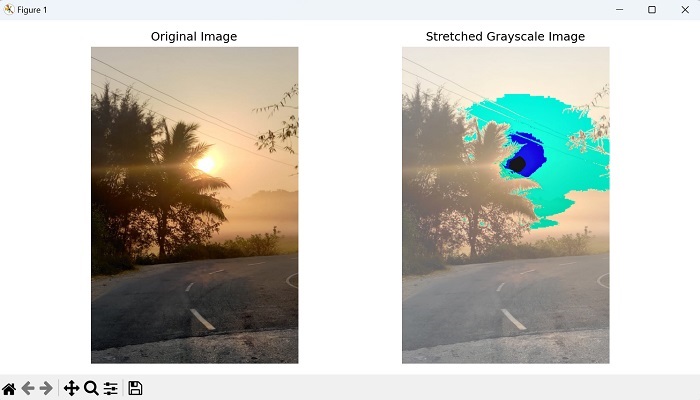
image = mh.imread('sun.png')
# Stretch image
stretched = mh.stretch(image, arg0=100, arg1=280)
# Create a figure with subplots
fig, axes = plt.subplots(1, 2, figsize=(10, 5))
# Display the original image
axes[0].imshow(image)
axes[0].set_title('Original Image')
axes[0].axis('off')
# Display the stretched grayscale image
axes[1].imshow(stretched, cmap='gray')
axes[1].set_title('Stretched Grayscale Image')
axes[1].axis('off')
# Adjust the layout and display the plot
plt.tight_layout()
plt.show()
輸出
以下是上述程式碼的輸出:
示例
在這個例子中,我們將看到如何使用mahotas.stretch_rgb函式來拉伸影像:
import mahotas as mh
import numpy as np
import matplotlib.pyplot as plt
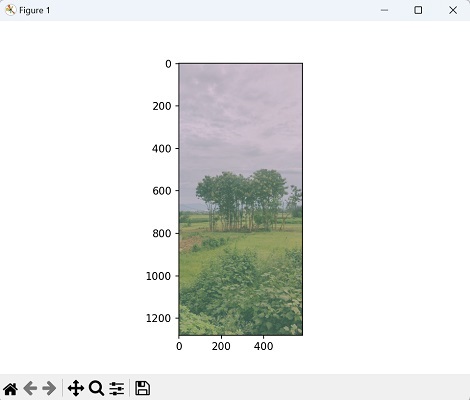
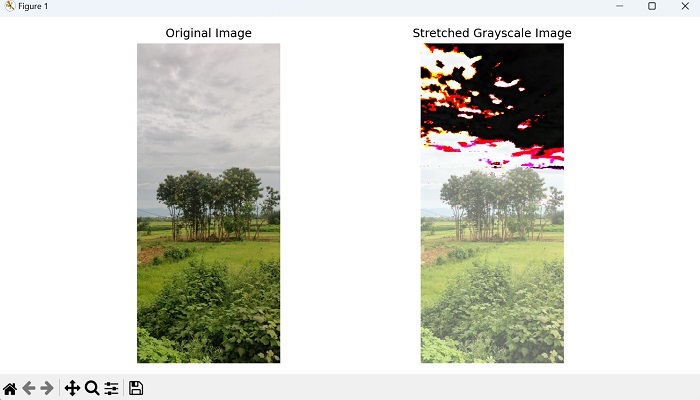
image = mh.imread('nature.jpeg')
# Stretch image
stretched = mh.stretch_rgb(image, arg0=100, arg1=280)
# Create a figure with subplots
fig, axes = plt.subplots(1, 2, figsize=(10, 5))
# Display the original image
axes[0].imshow(image)
axes[0].set_title('Original Image')
axes[0].axis('off')
# Display the stretched grayscale image
axes[1].imshow(stretched, cmap='gray')
axes[1].set_title('Stretched Grayscale Image')
axes[1].axis('off')
# Adjust the layout and display the plot
plt.tight_layout()
plt.show()
輸出
以下是上述程式碼的輸出:
使用百分位數值拉伸影像
要在Mahotas中使用百分位數值拉伸RGB影像,我們可以手動計算百分位數並分別對每個顏色通道使用stretch函式:
- 首先,將RGB影像拆分為各個顏色通道(紅色、綠色和藍色)。
- 這可以透過使用NumPy庫中的np.split()函式來實現。
- 一旦影像被拆分,使用NumPy的np.percentile()函式計算每個顏色通道所需的百分位數。
- 獲得百分位數後,獨立地對每個通道使用Mahotas的stretch()函式,使用計算出的最小值和最大值。
- 這將根據指定的百分位數範圍拉伸每個通道中的畫素值。
最後,透過沿顏色通道軸連線它們,將拉伸後的通道合併回RGB影像。生成的影像將是基於指定百分位數的拉伸RGB影像。
示例
在這裡,我們嘗試使用百分位數值拉伸影像:
import mahotas as mh
import numpy as np
from pylab import imshow, show
image = mh.imread('nature.jpeg')
# Splitting the RGB image into individual channels
r, g, b = np.split(image, 3, axis=2)
# Calculating percentiles for each channel
r_min, r_max = np.percentile(r, [17, 90])
g_min, g_max = np.percentile(g, [25, 75])
b_min, b_max = np.percentile(b, [50, 99])
# Stretching each channel independently
stretched_r = mh.stretch(r, r_min, r_max)
stretched_g = mh.stretch(g, g_min, g_max)
stretched_b = mh.stretch(b, b_min, b_max)
# Merging the stretched channels back into an RGB image
stretched_image = np.concatenate((stretched_r, stretched_g, stretched_b),
axis=2)
imshow(stretched_image)
show()
輸出
執行上述程式碼後,我們將得到以下輸出: