- Mahotas 教程
- Mahotas - 首頁
- Mahotas - 簡介
- Mahotas - 計算機視覺
- Mahotas - 歷史
- Mahotas - 特性
- Mahotas - 安裝
- Mahotas 影像處理
- Mahotas - 影像處理
- Mahotas - 載入影像
- Mahotas - 載入灰度影像
- Mahotas - 顯示影像
- Mahotas - 顯示影像形狀
- Mahotas - 儲存影像
- Mahotas - 影像質心
- Mahotas - 影像卷積
- Mahotas - 建立RGB影像
- Mahotas - 影像尤拉數
- Mahotas - 影像中零的比例
- Mahotas - 獲取影像矩
- Mahotas - 影像區域性最大值
- Mahotas - 影像橢圓軸
- Mahotas - 影像RGB拉伸
- Mahotas 顏色空間轉換
- Mahotas - 顏色空間轉換
- Mahotas - RGB到灰度轉換
- Mahotas - RGB到LAB轉換
- Mahotas - RGB到褐色轉換
- Mahotas - RGB到XYZ轉換
- Mahotas - XYZ到LAB轉換
- Mahotas - XYZ到RGB轉換
- Mahotas - 增加伽馬校正
- Mahotas - 拉伸伽馬校正
- Mahotas 標籤影像函式
- Mahotas - 標籤影像函式
- Mahotas - 影像標記
- Mahotas - 過濾區域
- Mahotas - 邊界畫素
- Mahotas - 形態學運算
- Mahotas - 形態學運算元
- Mahotas - 求影像均值
- Mahotas - 裁剪影像
- Mahotas - 影像離心率
- Mahotas - 影像疊加
- Mahotas - 影像圓度
- Mahotas - 影像縮放
- Mahotas - 影像直方圖
- Mahotas - 影像膨脹
- Mahotas - 影像腐蝕
- Mahotas - 分水嶺演算法
- Mahotas - 影像開運算
- Mahotas - 影像閉運算
- Mahotas - 填充影像空洞
- Mahotas - 條件膨脹影像
- Mahotas - 條件腐蝕影像
- Mahotas - 影像條件分水嶺演算法
- Mahotas - 影像區域性最小值
- Mahotas - 影像區域最大值
- Mahotas - 影像區域最小值
- Mahotas - 高階概念
- Mahotas - 影像閾值化
- Mahotas - 設定閾值
- Mahotas - 軟閾值
- Mahotas - Bernsen區域性閾值化
- Mahotas - 小波變換
- 生成影像小波中心
- Mahotas - 距離變換
- Mahotas - 多邊形工具
- Mahotas - 區域性二值模式
- 閾值鄰域統計
- Mahotas - Haralick特徵
- 標記區域的權重
- Mahotas - Zernike特徵
- Mahotas - Zernike矩
- Mahotas - 排序濾波器
- Mahotas - 二維拉普拉斯濾波器
- Mahotas - 多數濾波器
- Mahotas - 均值濾波器
- Mahotas - 中值濾波器
- Mahotas - Otsu方法
- Mahotas - 高斯濾波
- Mahotas - Hit & Miss變換
- Mahotas - 標記最大值陣列
- Mahotas - 影像均值
- Mahotas - SURF密集點
- Mahotas - SURF積分影像
- Mahotas - Haar變換
- 突出影像最大值
- 計算線性二值模式
- 獲取標籤邊界
- 反轉Haar變換
- Riddler-Calvard方法
- 標記區域大小
- Mahotas - 模板匹配
- 加速魯棒特徵
- 移除邊界標記
- Mahotas - Daubechies小波
- Mahotas - Sobel邊緣檢測
Mahotas - 多邊形工具
多邊形工具是一組旨在處理多邊形的工具。多邊形是指由一系列連線的頂點定義的封閉形狀。這些工具提供執行與多邊形相關的各種任務的功能,例如操作、面積計算、點在多邊形內測試等等。
在內部,Mahotas中的多邊形工具利用計算幾何中的演算法和技術來實現其功能。這些底層演算法確保多邊形操作和分析的準確性和效率。
總的來說,Mahotas中的多邊形工具作為處理影像處理任務中多邊形的工具箱,提供必要的函式和演算法來高效地操作、分析和執行這些形狀的操作。
Mahotas中的多邊形工具函式
以下是Mahotas中提供的不同多邊形工具函式:
| 序號 | 函式及描述 |
|---|---|
| 1 | convexhull() 此函式建立包含一組點的最小形狀,同時保持其凸性(凸包)。 |
| 2 | fill_convexhull() 此函式填充由一組點生成的凸包的內部。 |
| 3 | fill_polygon() 此函式填充由一組點定義的多邊形的內部。 |
| 4 | line() 此函式繪製兩指定點之間的直線。 |
現在,讓我們簡要了解這四個函式並檢視它們的示例。
convexhull() 函式
convexhull() 函式生成影像中一組點的凸包。凸包是包含給定點的最小多邊形。該函式透過識別多邊形的頂點並確保所有內角小於或等於180度來生成凸包。
語法
以下是Mahotas中convexhull()函式的基本語法:
mahotas.polygon.convexhull(bwimg)
其中,
bwimg − 輸入二值影像。
示例
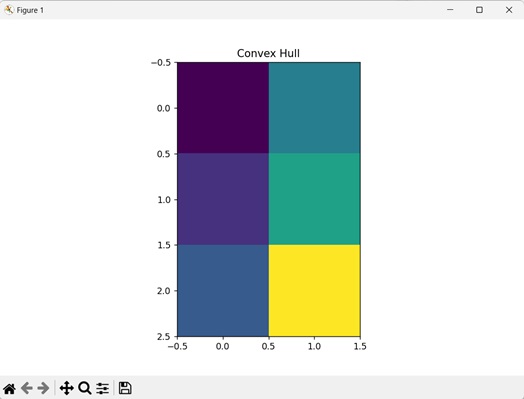
在下面的示例中,我們使用convexhull()函式獲取影像的凸包。
import mahotas as mh
import numpy as np
import matplotlib.pyplot as mtplt
image = np.zeros((10, 10), bool)
image[2, 5] = 1
image[3, 6] = 1
image[4, 9] = 1
# Computing convex hull
convex_hull = mh.polygon.convexhull(image)
# Printing the value of the hull
print(convex_hull)
# Displaying the convex hull
mtplt.imshow(convex_hull)
mtplt.title('Convex Hull')
# Showing the figures
mtplt.show()
輸出
以下是上述程式碼的輸出:
[[2 5]
 [3 6]
 [4 9]]
獲得的影像是:
fill_convexhull() 函式
fill_convexhull() 函式使用影像中一組點生成的顏色填充凸包的內部。該函式確保凸包內的所有畫素都被分配特定顏色。
語法
以下是Mahotas中fill_convexhull()函式的基本語法:
mahotas.polygon.fill_convexhull(bwimg)
其中,
bwimg − 輸入二值影像。
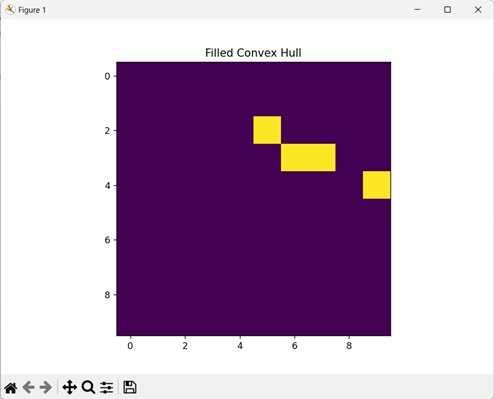
示例
這裡,我們使用fill_convexhull()函式用顏色填充凸包。
import mahotas as mh
import numpy as np
import matplotlib.pyplot as mtplt
image = np.zeros((10, 10), bool)
image[2, 5] = 1
image[3, 6] = 1
image[4, 9] = 1
# Filling convex hull
fill_convexhull = mh.polygon.fill_convexhull(image)
# Displaying the filled convex hull
mtplt.imshow(fill_convexhull)
mtplt.title('Filled Convex Hull')
# Showing the figures
mtplt.show()
輸出
執行上述程式碼後,我們得到以下輸出:
fill_polygon() 函式
類似地,fill_polygon()函式用於在影像中用特定顏色填充多邊形的內部。它採用表示多邊形形狀的點,並在多邊形邊界內執行填充操作。
語法
以下是Mahotas中fill_polygon()函式的基本語法:
mahotas.polygon.fill_polygon([(y0, x0), (y1, x1), ..., ], canvas, color=1)
其中,
[(y0, x0), (y1, x1), ..., ] − 這些是定義多邊形形狀的(y, x)座標列表。
canvas − 將填充多邊形的影像。
color (可選) − 確定多邊形內畫素的顏色(預設為1)。
示例
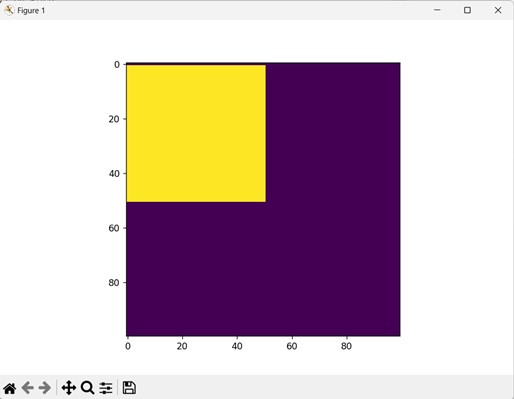
在這個例子中,我們使用fill_polygon()函式用顏色填充一個多邊形。
import numpy as np
import matplotlib.pyplot as mtplt
import mahotas.polygon as mp
# Create a 100x100 image with all zeros
canvas = np.zeros((100, 100), dtype=np.uint8)
# Define the polygon as a list of (y, x) points
polygon = [(0, 0), (50, 0), (50, 50), (0, 50)]
# Fill the polygon in the canvas.
mp.fill_polygon(polygon, canvas, color=255)
# Display the image
plt.imshow(canvas, cmap='gray')
plt.show()
輸出
我們得到以下輸出影像:
line() 函式
line() 函式用於在影像中繪製兩指定點(起點和終點)之間的直線。這些點由它們的x和y座標表示。x0和y0是起點的座標,x1和y1是終點的座標。
語法
以下是Mahotas中line()函式的基本語法:
mahotas.polygon.line((y0, x0), (y1, x1), canvas, color=1)
其中,
(y0, x0) − 指定直線起點的元組。
(y1, x1) − 指定直線終點的元組。
canvas − 將繪製直線的影像。
color (可選) − 確定多邊形內畫素的顏色(預設為1)。
示例
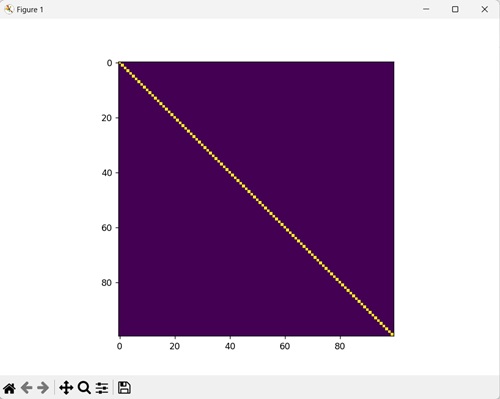
在下面的例子中,我們使用line()函式繪製一條彩色直線。
import numpy as np
import matplotlib.pyplot as mtplt
import mahotas.polygon as mp
# Create a 100x100 image with all zeros
canvas = np.zeros((100, 100), dtype=np.uint8)
# Draw a line in the canvas
mp.line((0, 0), (99, 99), canvas, color=255)
# Display the image
mtplt.imshow(canvas)
mtplt.show()
輸出
以下是上述程式碼的輸出: