- Mahotas 教程
- Mahotas - 首頁
- Mahotas - 簡介
- Mahotas - 計算機視覺
- Mahotas - 歷史
- Mahotas - 特性
- Mahotas - 安裝
- Mahotas 影像處理
- Mahotas - 影像處理
- Mahotas - 載入影像
- Mahotas - 以灰度載入影像
- Mahotas - 顯示影像
- Mahotas - 顯示影像形狀
- Mahotas - 儲存影像
- Mahotas - 影像質心
- Mahotas - 影像卷積
- Mahotas - 建立RGB影像
- Mahotas - 影像尤拉數
- Mahotas - 影像中零的比例
- Mahotas - 獲取影像矩
- Mahotas - 影像中的區域性最大值
- Mahotas - 影像橢圓軸
- Mahotas - 影像拉伸RGB
- Mahotas 顏色空間轉換
- Mahotas - 顏色空間轉換
- Mahotas - RGB到灰度轉換
- Mahotas - RGB到LAB轉換
- Mahotas - RGB到棕褐色轉換
- Mahotas - RGB到XYZ轉換
- Mahotas - XYZ到LAB轉換
- Mahotas - XYZ到RGB轉換
- Mahotas - 增加伽馬校正
- Mahotas - 拉伸伽馬校正
- Mahotas 標籤影像函式
- Mahotas - 標籤影像函式
- Mahotas - 影像標記
- Mahotas - 過濾區域
- Mahotas - 邊界畫素
- Mahotas - 形態學運算
- Mahotas - 形態學運算元
- Mahotas - 查詢影像平均值
- Mahotas - 裁剪影像
- Mahotas - 影像偏心率
- Mahotas - 影像疊加
- Mahotas - 影像圓度
- Mahotas - 影像縮放
- Mahotas - 影像直方圖
- Mahotas - 影像膨脹
- Mahotas - 影像腐蝕
- Mahotas - 分水嶺演算法
- Mahotas - 影像開運算
- Mahotas - 影像閉運算
- Mahotas - 填充影像空洞
- Mahotas - 條件膨脹影像
- Mahotas - 條件腐蝕影像
- Mahotas - 影像條件分水嶺演算法
- Mahotas - 影像區域性最小值
- Mahotas - 影像區域最大值
- Mahotas - 影像區域最小值
- Mahotas - 高階概念
- Mahotas - 影像閾值化
- Mahotas - 設定閾值
- Mahotas - 軟閾值
- Mahotas - Bernsen區域性閾值化
- Mahotas - 小波變換
- 製作影像小波中心
- Mahotas - 距離變換
- Mahotas - 多邊形工具
- Mahotas - 區域性二值模式
- 閾值鄰域統計
- Mahotas - Haralick特徵
- 標記區域的權重
- Mahotas - Zernike特徵
- Mahotas - Zernike矩
- Mahotas - 排序濾波器
- Mahotas - 2D拉普拉斯濾波器
- Mahotas - 多數濾波器
- Mahotas - 均值濾波器
- Mahotas - 中值濾波器
- Mahotas - Otsu方法
- Mahotas - 高斯濾波
- Mahotas - Hit & Miss變換
- Mahotas - 標記最大值陣列
- Mahotas - 影像平均值
- Mahotas - SURF密集點
- Mahotas - SURF積分影像
- Mahotas - Haar變換
- 突出顯示影像最大值
- 計算線性二值模式
- 獲取標籤邊界
- 反轉Haar變換
- Riddler-Calvard方法
- 標記區域的大小
- Mahotas - 模板匹配
- 加速魯棒特徵
- 去除邊界標記
- Mahotas - Daubechies小波
- Mahotas - Sobel邊緣檢測
Mahotas - 查詢影像平均值
當我們談論查詢影像平均值時,指的是計算影像中所有畫素的平均強度值。
數字影像中的每個畫素都由一個數值表示,該數值對應於其強度或顏色資訊。
強度值的範圍取決於影像的色深,例如灰度影像的8位(0-255)或彩色影像的24位(每個顏色通道0-255)。
查詢影像平均值包括將影像中所有畫素的強度值相加,然後除以畫素總數。
此過程提供單個值,表示影像的平均強度。它可以解釋為影像的整體亮度或強度級別。
在Mahotas中查詢影像平均值
我們可以使用mahotas.mean()函式在Mahotas中查詢影像平均值。此函式接受影像陣列並返回其平均值。
眾所周知,Mahotas一次只能查詢一個通道的平均值,因此我們需要將彩色影像轉換為單通道才能查詢該通道的平均值。
平均值函式返回一個標量值,表示影像中所有畫素的平均值。
語法
以下是平均值函式的基本語法:
Image_name.mean()
示例
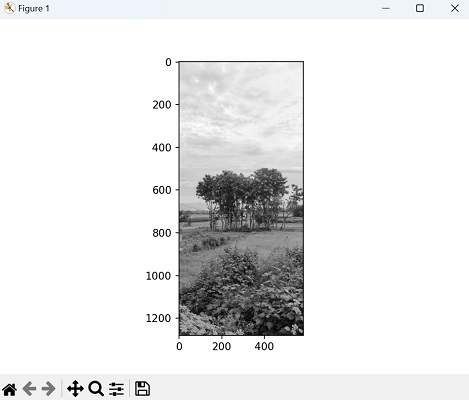
在以下示例中,我們查詢影像的平均值並顯示具有平均強度的影像:
import mahotas as mh
import numpy as np
from pylab import imshow, show
import matplotlib.pyplot as plt
image = mh.imread('nature.jpeg', as_grey = True)
find_mean = image.mean()
print("Mean of the image is:", find_mean)
imshow(image,cmap='gray')
show()
輸出
Mean of the image is: 134.99541438411237
顯示的影像如下所示:
每個通道的影像平均值
我們還可以使用Mahotas查詢RGB影像中每個通道的平均值。首先,計算整個影像的平均值,然後使用陣列切片分別計算每個通道的平均值。
切片影像[:, :, 0]對應於通道0(紅色),影像[:, :, 1]對應於通道1(綠色),影像[:, :, 2]對應於通道2(藍色)。它使用mean()函式計算每個通道的平均值並列印結果。
示例
在這個例子中,我們嘗試查詢影像各個通道的平均值:
import mahotas as mh
import numpy as np
image = mh.imread('sun.png')
# Calculating the mean of the entire image
print("Mean of the image: {0}".format(image.mean()))
# Calculating the mean of Channel 0 (Red)
img0 = image[:, :, 0]
print('Mean of channel 0: {0}'.format(img0.mean()))
# Calculating the mean of Channel 1 (Green)
img1 = image[:, :, 1]
print('Mean of channel 1: {0}'.format(img1.mean()))
# Calculating the mean of Channel 2 (Blue)
img2 = image[:, :, 2]
print('Mean of channel 2: {0}'.format(img2.mean()))
輸出
執行上述程式碼後,我們得到如下所示的輸出:
Mean of the image: 105.32921300415184
Mean of channel 0: 126.04734671559905
Mean of channel 1: 106.04269535883749
Mean of channel 2: 83.89759693801898
查詢影像中感興趣區域(ROI)的平均值
我們可以使用影像陣列上的切片操作來查詢影像中感興趣區域 (ROI) 的平均值。之後,計算ROI內所有通道(如果影像是彩色的)的平均值或灰度值(如果影像是灰度影像)的平均值。
以下是定義影像ROI的語法:
image[start_row:end_row, start_column:end_column]
其中,'start_row'和'end_row'表示行的範圍,'start_column'和'end_column'表示定義ROI的列的範圍。
因此,為了指定影像中的感興趣區域,我們選擇行和列的子集。
示例
在這裡,我們查詢影像感興趣區域的平均值:
import mahotas as mh
import numpy as np
image = mh.imread('tree.tiff')
# Defining a specific region of interest
roi = image[100:300, 200:400]
roi_mean = np.mean(roi)
print("Mean of the image is:", roi_mean)
輸出
上述程式碼的輸出如下:
Mean of the image is: 98.556925