- Mahotas 教程
- Mahotas - 首頁
- Mahotas - 簡介
- Mahotas - 計算機視覺
- Mahotas - 歷史
- Mahotas - 特性
- Mahotas - 安裝
- Mahotas 處理影像
- Mahotas - 處理影像
- Mahotas - 載入影像
- Mahotas - 載入灰度影像
- Mahotas - 顯示影像
- Mahotas - 顯示影像形狀
- Mahotas - 儲存影像
- Mahotas - 影像的質心
- Mahotas - 影像卷積
- Mahotas - 建立 RGB 影像
- Mahotas - 影像的尤拉數
- Mahotas - 影像中零的比例
- Mahotas - 獲取影像矩
- Mahotas - 影像中的區域性最大值
- Mahotas - 影像橢圓軸
- Mahotas - 影像拉伸 RGB
- Mahotas 顏色空間轉換
- Mahotas - 顏色空間轉換
- Mahotas - RGB 到灰度轉換
- Mahotas - RGB 到 LAB 轉換
- Mahotas - RGB 到 Sepia 轉換
- Mahotas - RGB 到 XYZ 轉換
- Mahotas - XYZ 到 LAB 轉換
- Mahotas - XYZ 到 RGB 轉換
- Mahotas - 增加伽馬校正
- Mahotas - 拉伸伽馬校正
- Mahotas 標籤影像函式
- Mahotas - 標籤影像函式
- Mahotas - 標註影像
- Mahotas - 過濾區域
- Mahotas - 邊界畫素
- Mahotas - 形態學操作
- Mahotas - 形態學運算元
- Mahotas - 查詢影像平均值
- Mahotas - 裁剪影像
- Mahotas - 影像的偏心率
- Mahotas - 影像疊加
- Mahotas - 影像的圓度
- Mahotas - 調整影像大小
- Mahotas - 影像直方圖
- Mahotas - 膨脹影像
- Mahotas - 腐蝕影像
- Mahotas - 分水嶺演算法
- Mahotas - 影像開運算
- Mahotas - 影像閉運算
- Mahotas - 填充影像孔洞
- Mahotas - 條件膨脹影像
- Mahotas - 條件腐蝕影像
- Mahotas - 影像條件分水嶺
- Mahotas - 影像中的區域性最小值
- Mahotas - 影像的區域最大值
- Mahotas - 影像的區域最小值
- Mahotas - 高階概念
- Mahotas - 影像閾值化
- Mahotas - 設定閾值
- Mahotas - 軟閾值
- Mahotas - Bernsen 區域性閾值化
- Mahotas - 小波變換
- 製作影像小波中心
- Mahotas - 距離變換
- Mahotas - 多邊形實用程式
- Mahotas - 區域性二值模式
- 閾值鄰域統計
- Mahotas - Haralick 特徵
- 標記區域的權重
- Mahotas - Zernike 特徵
- Mahotas - Zernike 矩
- Mahotas - 排序濾波器
- Mahotas - 2D 拉普拉斯濾波器
- Mahotas - 多數濾波器
- Mahotas - 均值濾波器
- Mahotas - 中值濾波器
- Mahotas - Otsu 方法
- Mahotas - 高斯濾波
- Mahotas - 擊中擊不中變換
- Mahotas - 標記最大陣列
- Mahotas - 影像平均值
- Mahotas - SURF 密集點
- Mahotas - SURF 積分
- Mahotas - Haar 變換
- 突出顯示影像最大值
- 計算線性二值模式
- 獲取標籤的邊界
- 反轉 Haar 變換
- Riddler-Calvard 方法
- 標記區域的大小
- Mahotas - 模板匹配
- 加速魯棒特徵
- 去除帶邊框的標籤
- Mahotas - Daubechies 小波
- Mahotas - Sobel 邊緣檢測
Mahotas - 影像平均值
影像的平均值指的是影像所有畫素的平均亮度。亮度是影像的一種屬性,決定了影像在人眼看來是明亮還是暗淡。
它由畫素強度值決定;較高的畫素強度值表示較亮的區域,而較低的畫素強度值表示較暗的區域。
影像的平均值廣泛用於影像分割,影像分割涉及將影像劃分為不同的區域。
它也可以用於影像閾值化,影像閾值化指的是將影像轉換為包含前景和背景畫素的二值影像。
Mahotas 中的影像平均值
Mahotas 沒有內建函式來查詢影像的平均值。但是,我們可以使用 mahotas 和 numpy 庫一起查詢影像的平均值。
我們可以使用 numpy 庫中的 mean() 函式來查詢影像的平均畫素強度值。
mean() 函式的工作原理是迭代遍歷每個畫素並將其強度值求和。遍歷完所有畫素後,它將總和除以畫素總數。
可以使用以下公式計算影像的平均畫素強度值:
Mean = Sum of all pixel values / Total number of pixels
例如,假設一個影像由 2 個畫素組成,每個畫素的強度值為 5。然後可以按如下方式計算平均值:
Mean = 10 / 2
Mean = 5
numpy.mean() 函式
numpy.mean() 函式以影像作為輸入,並將其所有畫素的平均亮度作為十進位制數返回。mean 函式適用於任何型別的輸入影像,例如 RGB、灰度或標記影像。
語法
以下是 numpy 中 mean() 函式的基本語法:
numpy.mean(image)
其中,
image - 它是要輸入的影像。
示例
在以下示例中,我們使用 np.mean() 函式查詢影像的平均畫素強度值。
import mahotas as mh
import numpy as np
import matplotlib.pyplot as mtplt
# Loading the image
image = mh.imread('sun.png')
# Finding the mean value
mean_value = np.mean(image)
# Printing the mean value
print('Mean value of the image is =', mean_value)
# Creating a figure and axes for subplots
fig, axes = mtplt.subplots(1, 1)
# Displaying the original image
axes.imshow(image)
axes.set_title('Original Image')
axes.set_axis_off()
# Adjusting spacing between subplots
mtplt.tight_layout()
# Showing the figures
mtplt.show()
輸出
以下是上述程式碼的輸出:
Mean value of the image is = 105.32921300415184
獲得的影像如下所示:

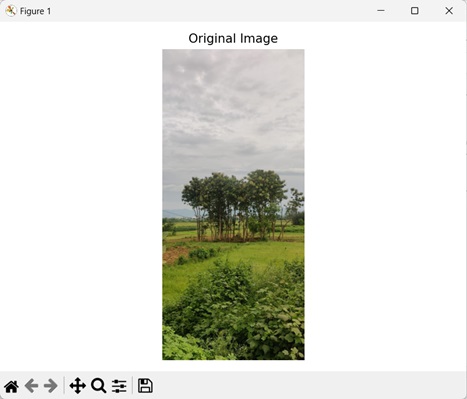
每個通道的平均值
我們還可以找到 Mahotas 中 RGB 影像每個通道的平均值。RGB 影像指的是具有三個顏色通道的影像:紅色、綠色和藍色。
RGB 影像中的每個畫素都有三個強度值,每個顏色通道一個。
紅色的通道值為 0,綠色的通道值為 1,藍色的通道值為 2。這些值可用於將 RGB 影像分離成其各個顏色分量。
在 mahotas 中,要查詢 RGB 影像每個通道的平均畫素強度值,我們首先將 RGB 影像分離成單獨的通道。這是透過指定通道值來實現的。分離通道後,我們可以分別找到它們的平均值。
示例
在下面提到的示例中,我們正在查詢 RGB 影像每個通道的平均畫素強度值。
import mahotas as mh
import numpy as np
import matplotlib.pyplot as mtplt
# Loading the image
image = mh.imread('nature.jpeg')
# Getting the red channel.
red_channel = image[:, :, 0]
# Getting the green channel.
green_channel = image[:, :, 1]
# Getting the blue channel.
blue_channel = image[:, :, 2]
# Finding the mean value of each channel
mean_red = np.mean(red_channel)
mean_green = np.mean(green_channel)
mean_blue = np.mean(blue_channel)
# Printing the mean value of each channel
print('Mean value of the Red channel is =', mean_red)
print('Mean value of the Green channel is =', mean_green)
print('Mean value of the Blue channel is =', mean_blue)
# Creating a figure and axes for subplots
fig, axes = mtplt.subplots(1, 1)
# Displaying the original image
axes.imshow(image)
axes.set_title('Original Image')
axes.set_axis_off()
# Adjusting spacing between subplots
mtplt.tight_layout()
# Showing the figures
mtplt.show()
輸出
上述程式碼的輸出如下:
Mean value of the Red channel is = 135.4501688464837
Mean value of the Green channel is = 139.46532482847343
Mean value of the Blue channel is = 109.7802007397084
生成的影像如下:
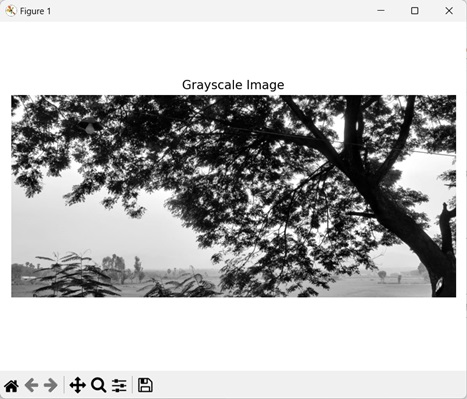
灰度影像的平均值
我們還可以找到灰度影像的平均值。灰度影像指的是隻有一個顏色通道的影像。
灰度影像的每個畫素都由單個強度值表示。
灰度影像的強度值範圍從 0(黑色)到 255(白色)。0 到 255 之間的任何值都會產生灰色陰影。較低的值會產生較暗的陰影,而較高的值會產生較亮的陰影。
在 mahotas 中,我們首先使用 mh.colors.rgb2gray() 函式將輸入 RGB 影像轉換為灰度。然後,我們使用 mean() 函式找到其平均畫素強度值。
示例
在此示例中,我們正在查詢灰度影像的平均畫素強度值。
import mahotas as mh
import numpy as np
import matplotlib.pyplot as mtplt
# Loading the image
image = mh.imread('tree.tiff')
# Converting it to grayscale
grayscale_image = mh.colors.rgb2gray(image)
# Finding the mean value of the grayscale image
mean_value = np.mean(grayscale_image)
# Printing the mean value of the image
print('Mean value of the grayscale image is =', mean_value)
# Creating a figure and axes for subplots
fig, axes = mtplt.subplots(1, 1)
# Displaying the grayscale image
axes.imshow(grayscale_image, cmap='gray')
axes.set_title('Grayscale Image')
axes.set_axis_off()
# Adjusting spacing between subplots
mtplt.tight_layout()
# Showing the figures
mtplt.show()
輸出
執行上述程式碼後,我們得到以下輸出:
Mean value of the grayscale image is = 113.21928107579335
以下是獲得的影像: