- Matlab 教程
- MATLAB - 首頁
- MATLAB - 概述
- MATLAB - 功能
- MATLAB - 環境設定
- MATLAB - 編輯器
- MATLAB - 線上版
- MATLAB - 工作區
- MATLAB - 語法
- MATLAB - 變數
- MATLAB - 命令
- MATLAB - 資料型別
- MATLAB - 運算子
- MATLAB - 日期和時間
- MATLAB - 數字
- MATLAB - 隨機數
- MATLAB - 字串和字元
- MATLAB - 文字格式化
- MATLAB - 時間表
- MATLAB - M 檔案
- MATLAB - 冒號表示法
- MATLAB - 資料匯入
- MATLAB - 資料匯出
- MATLAB - 資料歸一化
- MATLAB - 預定義變數
- MATLAB - 決策
- MATLAB - 決策語句
- MATLAB - if 語句
- MATLAB - if else 語句
- MATLAB - if…elseif else 語句
- MATLAB - 巢狀 if 語句
- MATLAB - switch 語句
- MATLAB - 巢狀 switch
- MATLAB - 迴圈
- MATLAB - 迴圈
- MATLAB - for 迴圈
- MATLAB - while 迴圈
- MATLAB - 巢狀迴圈
- MATLAB - break 語句
- MATLAB - continue 語句
- MATLAB - end 語句
- MATLAB - 陣列
- MATLAB - 陣列
- MATLAB - 向量
- MATLAB - 轉置運算子
- MATLAB - 陣列索引
- MATLAB - 多維陣列
- MATLAB - 相容陣列
- MATLAB - 分類陣列
- MATLAB - 元胞陣列
- MATLAB - 矩陣
- MATLAB - 稀疏矩陣
- MATLAB - 表格
- MATLAB - 結構體
- MATLAB - 陣列乘法
- MATLAB - 陣列除法
- MATLAB - 陣列函式
- MATLAB - 函式
- MATLAB - 函式
- MATLAB - 函式引數
- MATLAB - 匿名函式
- MATLAB - 巢狀函式
- MATLAB - return 語句
- MATLAB - 無返回值函式
- MATLAB - 區域性函式
- MATLAB - 全域性變數
- MATLAB - 函式控制代碼
- MATLAB - filter 函式
- MATLAB - 階乘
- MATLAB - 私有函式
- MATLAB - 子函式
- MATLAB - 遞迴函式
- MATLAB - 函式優先順序
- MATLAB - map 函式
- MATLAB - mean 函式
- MATLAB - end 函式
- MATLAB - 錯誤處理
- MATLAB - 錯誤處理
- MATLAB - try…catch 語句
- MATLAB - 除錯
- MATLAB - 繪圖
- MATLAB - 繪圖
- MATLAB - 繪製陣列
- MATLAB - 繪製向量
- MATLAB - 條形圖
- MATLAB - 直方圖
- MATLAB - 圖形
- MATLAB - 二維線圖
- MATLAB - 三維圖
- MATLAB - 格式化繪圖
- MATLAB - 對數座標軸繪圖
- MATLAB - 繪製誤差條
- MATLAB - 繪製三維等高線圖
- MATLAB - 極座標圖
- MATLAB - 散點圖
- MATLAB - 繪製表示式或函式
- MATLAB - 繪製矩形
- MATLAB - 繪製頻譜圖
- MATLAB - 繪製網格曲面圖
- MATLAB - 繪製正弦波
- MATLAB - 插值
- MATLAB - 插值
- MATLAB - 線性插值
- MATLAB - 二維陣列插值
- MATLAB - 三維陣列插值
- MATLAB - 多項式
- MATLAB - 多項式
- MATLAB - 多項式加法
- MATLAB - 多項式乘法
- MATLAB - 多項式除法
- MATLAB - 多項式的導數
- MATLAB - 變換
- MATLAB - 變換函式
- MATLAB - 拉普拉斯變換
- MATLAB - 拉普拉斯濾波器
- MATLAB - 高斯-拉普拉斯濾波器
- MATLAB - 逆傅立葉變換
- MATLAB - 傅立葉變換
- MATLAB - 快速傅立葉變換
- MATLAB - 二維逆餘弦變換
- MATLAB - 向座標軸新增圖例
- MATLAB - 面向物件
- MATLAB - 面向物件程式設計
- MATLAB - 類和物件
- MATLAB - 函式過載
- MATLAB - 運算子過載
- MATLAB - 使用者自定義類
- MATLAB - 複製物件
- MATLAB - 代數
- MATLAB - 線性代數
- MATLAB - 高斯消元法
- MATLAB - 高斯-約旦消元法
- MATLAB - 簡化行階梯形式
- MATLAB - 特徵值和特徵向量
- MATLAB - 積分
- MATLAB - 積分
- MATLAB - 二重積分
- MATLAB - 梯形法則
- MATLAB - 辛普森法則
- MATLAB - 其他
- MATLAB - 微積分
- MATLAB - 微分
- MATLAB - 矩陣求逆
- MATLAB - GNU Octave
- MATLAB - Simulink
- MATLAB - 有用資源
- MATLAB - 快速指南
- MATLAB - 有用資源
- MATLAB - 討論
MATLAB - 繪製向量
在 MATLAB 中,向量是用於儲存和處理元素序列的基本資料結構。它們表示可以包含數字、字元、邏輯值或其他 MATLAB 物件的一維陣列。
MATLAB 中的向量可以通過幾種方式建立:
- 行向量 - 使用方括號建立,元素之間用空格或逗號分隔。例如:v = [1, 2, 3, 4]。
- 列向量 - 與行向量類似,但元素之間用分號分隔以建立列。例如:v = [1; 2; 3; 4]。
- 使用函式 - MATLAB 函式(如 linspace、ones、zeros 和 rand)可以生成具有特定特徵的向量(例如,值範圍、全是 1、全是 0、隨機值)。
MATLAB 中的向量允許進行各種運算,例如加法、減法、逐元素乘法、除法等等。它們在 MATLAB 中的數學計算、訊號處理、資料分析和繪圖中起著至關重要的作用。
建立 Matlab 向量
建立 Matlab 向量非常容易,以下是行向量和列向量的示例:
% Row vector with elements 1, 2, 3, 4
row_vector = [1, 2, 3, 4];

% Column vector with elements 5, 6, 7, 8
column_vector = [5; 6; 7; 8];
讓我們使用函式來建立向量,如下所示:
% Creates a row vector of 10 linearly spaced points from 0 to 1
linear_vector = linspace(0, 1, 10);

% Row vector of 5 ones
ones_vector = ones(1, 5);

% Column vector of 4 zeros
zeros_vector = zeros(4, 1);
使用的函式是 linspace()、ones() 和 zeros()。
在 Matlab 中繪製向量
可以使用 quiver() 函式在 Matlab 中繪製向量。
語法
quiver(X,Y,U,V)
quiver(U,V)
quiver(___,scale)
quiver(___,LineSpec)
讓我們詳細瞭解每種語法。
quiver(X,Y,U,V) - MATLAB 中的 quiver(X,Y,U,V) 函式使用在特定笛卡爾座標 X 和 Y 處的方向分量 U 和 V 生成箭頭圖。例如,每個箭頭都從座標 X(1)、Y(1) 開始,水平方向基於 U(1),垂直方向基於 V(1)。預設情況下,quiver 會自動調整箭頭長度以防止重疊。
quiver(U,V) - MATLAB 中的 quiver(U,V) 函式使用在均勻分佈的位置處的方向分量 U 和 V 生成箭頭圖。當 U 和 V 是向量時,箭頭的 x 座標跨越從 1 到 U 和 V 中元素的數量,而它們的 y 座標都設定為 1。如果 U 和 V 是矩陣,則箭頭的 x 座標跨越從 1 到 U 和 V 中的列數,而它們的 y 座標範圍從 1 到 U 和 V 中的行數。
quiver(___,scale) - MATLAB 中的 quiver(___, scale) 函式按以下方式修改箭頭長度:
- 如果 scale 是正值,則該函式會自動調整箭頭大小以防止重疊,然後按指定的比例因子縮放它們。例如,比例因子為 2 會使箭頭長度加倍,而 0.5 會使箭頭長度減半。
- 當 scale 設定為 'off' 或 0(例如,quiver(X,Y,U,V,'off'))時,自動縮放功能將被停用,從而停用箭頭長度的自動調整。
quiver(___,LineSpec) - quiver(___, LineSpec) 函式配置繪圖的線型、標記和顏色。標記位於 X 和 Y 指定的座標處。當使用 LineSpec 指定標記時,不會顯示箭頭。要顯示帶有標記的箭頭,最好單獨設定 Marker 屬性。
向量繪圖示例
以下是一些向量繪圖示例:
示例 1
在此示例中,X 和 Y 表示箭頭開始的座標。
U 和 V 表示方向分量,U 確定箭頭的水平長度,V 確定箭頭的垂直長度。
% Define coordinates and directional components
X = [1, 2, 3]; % X-coordinates
Y = [1, 1, 1]; % Y-coordinates
U = [2, -1, 3]; % Horizontal components
V = [3, 1, -2]; % Vertical components

% Plotting arrows using quiver

quiver(X, Y, U, V);

% Setting plot properties
xlabel('X-axis');
ylabel('Y-axis');
title('Arrow Plot using quiver');
讓我們執行程式碼並檢查輸出:
示例 2
在此示例中,U_vector 和 V_vector 分別表示沿 x 軸和 y 軸的方向分量。
由於 U_vector 和 V_vector 都是向量,因此箭頭的 x 座標將跨越從 1 到向量中元素的數量,而所有箭頭的 y 座標都將設定為 1。
% Creating vectors U and V
U_vector = [1, 2, 3, 4]; % Directional components for x-axis
V_vector = [2, 1, 3, 2]; % Directional components for y-axis

% Plotting arrows using quiver with vectors
quiver(U_vector, V_vector);

% Setting plot properties
xlabel('X-axis');
ylabel('Y-axis');
title('Arrow Plot using quiver with Vectors');
執行後,輸出如下:
示例 3
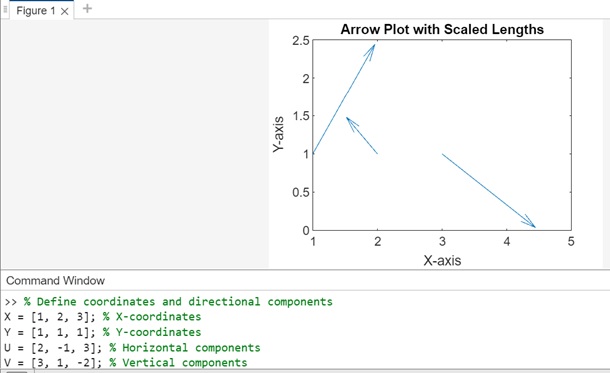
使用正值縮放圖形。在此示例中,X、Y、U 和 V 定義座標和方向分量。quiver 函式與比例因子 1.5 一起使用,該因子會自動調整和縮放箭頭長度。
% Define coordinates and directional components
X = [1, 2, 3]; % X-coordinates
Y = [1, 1, 1]; % Y-coordinates
U = [2, -1, 3]; % Horizontal components
V = [3, 1, -2]; % Vertical components

% Plotting arrows with automatic scaling by a factor of 1.5

quiver(X, Y, U, V, 1.5);

% Setting plot properties
xlabel('X-axis');
ylabel('Y-axis');
title('Arrow Plot with Scaled Lengths');
執行後,輸出為:
示例 4
此示例將演示 LineSpec 的用法。因此,X、Y、U 和 V 定義座標和方向分量。quiver() 函式與 LineSpec 引數 'ro' 一起使用,該引數將紅色圓圈設定為指定座標處的標記,而不會顯示箭頭。
% Define coordinates and directional components
X = [1, 2, 3]; % X-coordinates
Y = [1, 1, 1]; % Y-coordinates
U = [2, -1, 3]; % Horizontal components
V = [3, 1, -2]; % Vertical components

% Plotting arrows with LineSpec to show markers without arrowheads
quiver(X, Y, U, V, 'ro'); % 'ro' sets red color and circles as markers

% Setting plot properties
xlabel('X-axis');
ylabel('Y-axis');
title('Arrow Plot with Markers using LineSpec');
執行後的輸出為: