- Matlab 教程
- MATLAB - 首頁
- MATLAB - 概述
- MATLAB - 特性
- MATLAB - 環境設定
- MATLAB - 編輯器
- MATLAB - 線上版
- MATLAB - 工作區
- MATLAB - 語法
- MATLAB - 變數
- MATLAB - 命令
- MATLAB - 資料型別
- MATLAB - 運算子
- MATLAB - 日期和時間
- MATLAB - 數字
- MATLAB - 隨機數
- MATLAB - 字串和字元
- MATLAB - 文字格式化
- MATLAB - 時間表
- MATLAB - M 檔案
- MATLAB - 冒號表示法
- MATLAB - 資料匯入
- MATLAB - 資料匯出
- MATLAB - 資料歸一化
- MATLAB - 預定義變數
- MATLAB - 決策
- MATLAB - 決策語句
- MATLAB - If End 語句
- MATLAB - If Else 語句
- MATLAB - If…Elseif Else 語句
- MATLAB - 巢狀 If 語句
- MATLAB - Switch 語句
- MATLAB - 巢狀 Switch
- MATLAB - 迴圈
- MATLAB - 迴圈
- MATLAB - For 迴圈
- MATLAB - While 迴圈
- MATLAB - 巢狀迴圈
- MATLAB - Break 語句
- MATLAB - Continue 語句
- MATLAB - End 語句
- MATLAB - 陣列
- MATLAB - 陣列
- MATLAB - 向量
- MATLAB - 轉置運算子
- MATLAB - 陣列索引
- MATLAB - 多維陣列
- MATLAB - 相容陣列
- MATLAB - 分類陣列
- MATLAB - 元胞陣列
- MATLAB - 矩陣
- MATLAB - 稀疏矩陣
- MATLAB - 表格
- MATLAB - 結構體
- MATLAB - 陣列乘法
- MATLAB - 陣列除法
- MATLAB - 陣列函式
- MATLAB - 函式
- MATLAB - 函式
- MATLAB - 函式引數
- MATLAB - 匿名函式
- MATLAB - 巢狀函式
- MATLAB - 返回語句
- MATLAB - 空函式
- MATLAB - 區域性函式
- MATLAB - 全域性變數
- MATLAB - 函式控制代碼
- MATLAB - 濾波器函式
- MATLAB - 階乘
- MATLAB - 私有函式
- MATLAB - 子函式
- MATLAB - 遞迴函式
- MATLAB - 函式優先順序順序
- MATLAB - Map 函式
- MATLAB - Mean 函式
- MATLAB - End 函式
- MATLAB - 錯誤處理
- MATLAB - 錯誤處理
- MATLAB - Try...Catch 語句
- MATLAB - 除錯
- MATLAB - 繪圖
- MATLAB - 繪圖
- MATLAB - 繪製陣列
- MATLAB - 繪製向量
- MATLAB - 條形圖
- MATLAB - 直方圖
- MATLAB - 圖形
- MATLAB - 2D 線性圖
- MATLAB - 3D 圖形
- MATLAB - 圖形格式化
- MATLAB - 對數座標軸圖形
- MATLAB - 繪製誤差條
- MATLAB - 繪製 3D 等值線圖
- MATLAB - 極座標圖
- MATLAB - 散點圖
- MATLAB - 繪製表示式或函式
- MATLAB - 繪製矩形
- MATLAB - 繪製頻譜圖
- MATLAB - 繪製網格曲面
- MATLAB - 繪製正弦波
- MATLAB - 插值
- MATLAB - 插值
- MATLAB - 線性插值
- MATLAB - 2D 陣列插值
- MATLAB - 3D 陣列插值
- MATLAB - 多項式
- MATLAB - 多項式
- MATLAB - 多項式加法
- MATLAB - 多項式乘法
- MATLAB - 多項式除法
- MATLAB - 多項式的導數
- MATLAB - 變換
- MATLAB - 變換函式
- MATLAB - 拉普拉斯變換
- MATLAB - 拉普拉斯濾波器
- MATLAB - 高斯-拉普拉斯濾波器
- MATLAB - 逆傅立葉變換
- MATLAB - 傅立葉變換
- MATLAB - 快速傅立葉變換
- MATLAB - 2D 逆餘弦變換
- MATLAB - 為座標軸新增圖例
- MATLAB - 面向物件
- MATLAB - 面向物件程式設計
- MATLAB - 類和物件
- MATLAB - 函式過載
- MATLAB - 運算子過載
- MATLAB - 使用者定義類
- MATLAB - 複製物件
- MATLAB - 代數
- MATLAB - 線性代數
- MATLAB - 高斯消去法
- MATLAB - 高斯-約旦消去法
- MATLAB - 簡化行階梯形式
- MATLAB - 特徵值和特徵向量
- MATLAB - 積分
- MATLAB - 積分
- MATLAB - 二重積分
- MATLAB - 梯形法則
- MATLAB - 辛普森法則
- MATLAB - 雜項
- MATLAB - 微積分
- MATLAB - 微分
- MATLAB - 矩陣的逆
- MATLAB - GNU Octave
- MATLAB - Simulink
- MATLAB - 有用資源
- MATLAB - 快速指南
- MATLAB - 有用資源
- MATLAB - 討論
MATLAB - 高斯-拉普拉斯濾波器
高斯濾波器是一種用於影像處理的線性濾波器,用於模糊或平滑影像。它以高斯函式命名,該函式用於定義濾波器的形狀。高斯濾波器通常用於減少影像中的噪聲和細節,使其更適合進一步處理或分析。
高斯-拉普拉斯 (LoG) 濾波器是一種流行的影像增強和邊緣檢測濾波器,用於影像處理。它是兩種濾波器的組合:高斯濾波器和拉普拉斯濾波器。高斯濾波器用於平滑影像並減少噪聲,而拉普拉斯濾波器用於檢測邊緣。
高斯-拉普拉斯濾波器可用於檢測影像中不同尺度的邊緣。透過改變高斯濾波器的標準差,可以控制檢測邊緣的尺度。較小的標準差檢測更精細的細節,而較大的標準差檢測更寬泛的特徵。
讓我們看看幾個高斯-拉普拉斯濾波器的示例。
示例 1:使用 fspecial() 函式
fspecial() 函式用於建立高斯濾波器,然後計算該高斯的拉普拉斯運算元以建立 LoG 濾波器。但是,拉普拉斯濾波器期望高斯濾波器為 double 型別。
我們的程式碼如下:
% Read the image
img = imread('peppers.jpg');

% Convert the image to grayscale
if size(img, 3) == 3
    img_gray = rgb2gray(img);
else
    img_gray = img;
end

% Create a Gaussian filter
sigma = 2; % Standard deviation of the Gaussian filter
hsize = 2 * ceil(3 * sigma) + 1; % Filter size
gaussian_filter = fspecial('gaussian', hsize, sigma);

% Create a Laplacian of Gaussian filter
log_filter = fspecial('log', hsize, sigma);

% Apply the LoG filter to the image
filtered_img = imfilter(double(img_gray), log_filter, 'conv', 'replicate');

% Display the original and filtered images
subplot(1, 2, 1);
imshow(img_gray);
title('Original Image');

subplot(1, 2, 2);
imshow(uint8(filtered_img));
title('Laplacian of Gaussian Filtered Image');
讓我們詳細瞭解程式碼:
img = imread('peppers.jpg');
此處,它從當前目錄讀取影像“peppers.jpg”並將其儲存在變數 img 中。
if size(img, 3) == 3
    img_gray = rgb2gray(img);
else
    img_gray = img;
end
如果影像為彩色(RGB 格式),則使用 rgb2gray 函式將其轉換為灰度。灰度影像儲存在變數 img_gray 中。如果影像已經是灰度影像,則按原樣儲存。
sigma = 2; % Standard deviation of the Gaussian filter
hsize = 2 * ceil(3 * sigma) + 1; % Filter size
gaussian_filter = fspecial('gaussian', hsize, sigma);
上面的程式碼建立了高斯濾波器。這裡,我們定義了高斯濾波器的標準差 sigma 並根據標準差計算濾波器大小 hsize。然後,我們使用 fspecial 函式建立高斯濾波器,其中“gaussian”作為濾波器型別。
log_filter = fspecial('log', hsize, sigma);
我們使用 fspecial 函式建立高斯-拉普拉斯濾波器,其中“log”作為濾波器型別。此濾波器表示高斯濾波器的拉普拉斯運算元,用於邊緣檢測。
filtered_img = imfilter(double(img_gray), log_filter, 'conv', 'replicate');
此處,將高斯-拉普拉斯濾波器應用於使用 imfilter 函式的灰度影像 img_gray。'conv' 選項指定應使用卷積應用濾波器,而“replicate”選項指定在濾波期間如何處理影像邊界。
subplot(1, 2, 1);
imshow(img_gray);
title('Original Image');

subplot(1, 2, 2);
imshow(uint8(filtered_img));
title('Laplacian of Gaussian Filtered Image');
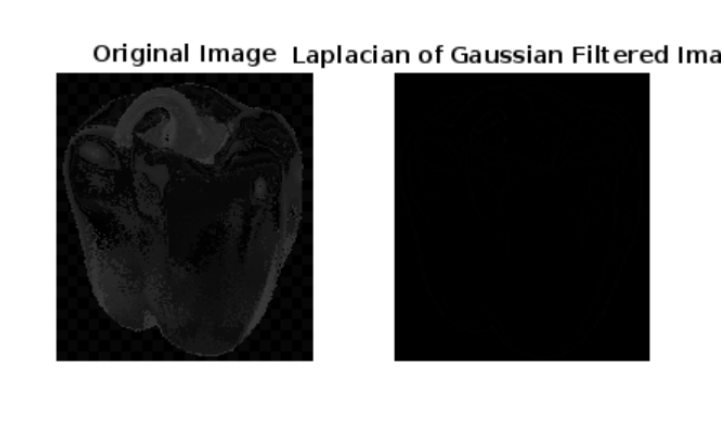
最後,我們使用 subplot、imshow 和 title 函式並排顯示原始灰度影像和濾波後的影像。濾波後的影像在顯示之前轉換為 uint8 格式。
執行程式碼後,我們得到如下輸出:
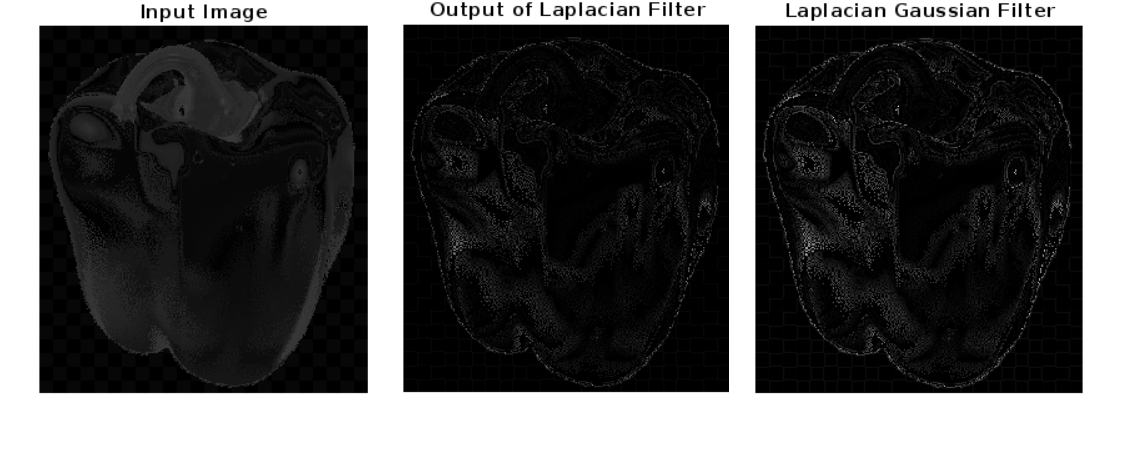
示例 2:使用拉普拉斯和 LoG 濾波器進行影像濾波
此示例顯示了將兩種不同的濾波器(拉普拉斯濾波器和高斯-拉普拉斯 (LoG) 濾波器)應用於輸入影像“peppers.jpg”
我們的程式碼如下:
x=imread('peppers.jpg');
figure;
imshow(x);
title('Input Image');
figure;
h=fspecial('laplacian');
filtered_image=imfilter(x,h);
imshow(filtered_image);
title('Output of Laplacian Filter');
figure;
h=fspecial('log');
filtered_image=imfilter(x,h);
imshow(filtered_image);
title('Laplacian Gaussian Filter');
在上面的示例中:
x = imread('peppers.jpg');
figure;
imshow(x);
title('Input Image');
此程式碼讀取影像“peppers.jpg”並使用 imshow 函式顯示它。title 函式在影像圖形中新增標題。
h = fspecial('laplacian');
filtered_image = imfilter(x, h);
這裡,使用 fspecial 函式建立拉普拉斯濾波器,其中“laplacian”作為濾波器型別。然後使用 imfilter 函式將此濾波器應用於輸入影像 x,從而產生濾波後的影像 filtered_image。
figure;
imshow(filtered_image);
title('Output of Laplacian Filter');
此程式碼顯示從拉普拉斯濾波器獲得的濾波後的影像。title 函式在影像圖形中新增標題。
h = fspecial('log');
filtered_image = imfilter(x, h);
與拉普拉斯濾波器類似,使用 fspecial 函式建立 LoG 濾波器,其中“log”作為濾波器型別。然後使用 imfilter 函式將此濾波器應用於輸入影像 x,從而產生濾波後的影像 filtered_image。
imshow(filtered_image);
title('Laplacian of Gaussian Filter');
此程式碼顯示從 LoG 濾波器獲得的濾波後的影像。title 函式在影像圖形中新增標題。
執行程式碼後,我們得到如下輸出: