- Matlab 教程
- MATLAB - 首頁
- MATLAB - 概述
- MATLAB - 特性
- MATLAB - 環境設定
- MATLAB - 編輯器
- MATLAB - 線上版
- MATLAB - 工作區
- MATLAB - 語法
- MATLAB - 變數
- MATLAB - 命令
- MATLAB - 資料型別
- MATLAB - 運算子
- MATLAB - 日期和時間
- MATLAB - 數字
- MATLAB - 隨機數
- MATLAB - 字串和字元
- MATLAB - 文字格式化
- MATLAB - 時間表
- MATLAB - M 檔案
- MATLAB - 冒號表示法
- MATLAB - 資料匯入
- MATLAB - 資料匯出
- MATLAB - 資料歸一化
- MATLAB - 預定義變數
- MATLAB - 決策
- MATLAB - 決策語句
- MATLAB - if 語句
- MATLAB - if-else 語句
- MATLAB - if-elseif-else 語句
- MATLAB - 巢狀 if 語句
- MATLAB - switch 語句
- MATLAB - 巢狀 switch
- MATLAB - 迴圈
- MATLAB - 迴圈
- MATLAB - for 迴圈
- MATLAB - while 迴圈
- MATLAB - 巢狀迴圈
- MATLAB - break 語句
- MATLAB - continue 語句
- MATLAB - end 語句
- MATLAB - 陣列
- MATLAB - 陣列
- MATLAB - 向量
- MATLAB - 轉置運算子
- MATLAB - 陣列索引
- MATLAB - 多維陣列
- MATLAB - 相容陣列
- MATLAB - 分類陣列
- MATLAB - 元胞陣列
- MATLAB - 矩陣
- MATLAB - 稀疏矩陣
- MATLAB - 表格
- MATLAB - 結構體
- MATLAB - 陣列乘法
- MATLAB - 陣列除法
- MATLAB - 陣列函式
- MATLAB - 函式
- MATLAB - 函式
- MATLAB - 函式引數
- MATLAB - 匿名函式
- MATLAB - 巢狀函式
- MATLAB - return 語句
- MATLAB - 無返回值函式
- MATLAB - 區域性函式
- MATLAB - 全域性變數
- MATLAB - 函式控制代碼
- MATLAB - filter 函式
- MATLAB - 階乘
- MATLAB - 私有函式
- MATLAB - 子函式
- MATLAB - 遞迴函式
- MATLAB - 函式優先順序
- MATLAB - map 函式
- MATLAB - mean 函式
- MATLAB - end 函式
- MATLAB - 錯誤處理
- MATLAB - 錯誤處理
- MATLAB - try...catch 語句
- MATLAB - 除錯
- MATLAB - 繪圖
- MATLAB - 繪圖
- MATLAB - 繪製陣列
- MATLAB - 繪製向量
- MATLAB - 條形圖
- MATLAB 直方圖
- MATLAB - 圖形
- MATLAB - 二維線圖
- MATLAB - 三維圖
- MATLAB - 格式化繪圖
- MATLAB - 對數座標軸繪圖
- MATLAB - 繪製誤差條
- MATLAB - 繪製三維等高線圖
- MATLAB - 極座標圖
- MATLAB - 散點圖
- MATLAB - 繪製表示式或函式
- MATLAB - 繪製矩形
- MATLAB - 繪製頻譜圖
- MATLAB - 繪製網格曲面圖
- MATLAB - 繪製正弦波
- MATLAB - 插值
- MATLAB - 插值
- MATLAB - 線性插值
- MATLAB - 二維陣列插值
- MATLAB - 三維陣列插值
- MATLAB - 多項式
- MATLAB - 多項式
- MATLAB - 多項式加法
- MATLAB - 多項式乘法
- MATLAB - 多項式除法
- MATLAB - 多項式的導數
- MATLAB - 變換
- MATLAB - 變換函式
- MATLAB - 拉普拉斯變換
- MATLAB - 拉普拉斯濾波器
- MATLAB - 高斯-拉普拉斯濾波器
- MATLAB - 逆傅立葉變換
- MATLAB - 傅立葉變換
- MATLAB - 快速傅立葉變換
- MATLAB - 二維逆餘弦變換
- MATLAB - 向座標軸新增圖例
- MATLAB - 面向物件
- MATLAB - 面向物件程式設計
- MATLAB - 類和物件
- MATLAB - 函式過載
- MATLAB - 運算子過載
- MATLAB - 使用者自定義類
- MATLAB - 複製物件
- MATLAB - 代數
- MATLAB - 線性代數
- MATLAB - 高斯消元法
- MATLAB - 高斯-約當消元法
- MATLAB - 簡化行階梯形
- MATLAB - 特徵值和特徵向量
- MATLAB - 積分
- MATLAB - 積分
- MATLAB - 二重積分
- MATLAB - 梯形法則
- MATLAB - 辛普森法則
- MATLAB - 其他
- MATLAB - 微積分
- MATLAB - 微分
- MATLAB - 矩陣的逆
- MATLAB - GNU Octave
- MATLAB - Simulink
- MATLAB - 有用資源
- MATLAB - 快速指南
- MATLAB - 有用資源
- MATLAB - 討論
MATLAB 直方圖
直方圖是圖形化地顯示數值資料分佈的圖表。MATLAB 提供了一個方便的函式 `histogram` 來建立直方圖,允許使用者視覺化資料集在不同區間或箱中的頻率或機率分佈。
語法
histogram(X)
histogram(X,nbins)
histogram(X,edges)
histogram('BinEdges',edges,'BinCounts',counts)
histogram(C)
histogram(C,Categories)
histogram('Categories',Categories,'BinCounts',counts)
語法的詳細解釋:
histogram(X) - `histogram(X)` 函式根據 X 中的資料生成直方圖。此函式採用自動分箱方法,生成寬度相等的箱,旨在涵蓋 X 中的值範圍並揭示固有的分佈模式。輸出顯示為矩形條,每個條的高度表示落入相應箱中的元素數量。
histogram(X,nbins) - `histogram(X, nbins)` 函式允許您定義直方圖中要使用的箱的數量。
histogram(X,edges) - `histogram(X, edges)` 函式將 X 中的資料組織到由向量中指定的邊緣確定的箱中。
histogram('BinEdges',edges,'BinCounts',counts) - `histogram('BinEdges', edges, 'BinCounts', counts)` 函式直接繪製提供的箱計數,無需對資料進行任何分箱。
histogram(C) - `histogram(C)` 函式生成一個直方圖,顯示分類陣列 C 中每個類別的條形。
histogram(C,Categories) - `histogram(C, Categories)` 函式專門繪製分類陣列 C 中選擇的類別。
histogram('Categories',Categories,'BinCounts',counts) - `histogram('Categories', Categories, 'BinCounts', counts)` 函式允許手動指定類別及其各自的箱計數。然後,直方圖繪製提供的箱計數,無需進行任何資料分箱。
直方圖屬性
直方圖函式返回一個物件。
直方圖的屬性控制其外觀和功能。更改這些屬性值可以調整直方圖的各個方面。使用點表示法訪問特定的物件屬性:
h = histogram(randn(10,1));
c = h.BinWidth;
h.BinWidth = 2;
直方圖中的箱
在直方圖中,箱代表資料被劃分到的區間。這些區間涵蓋資料的範圍,並用於計算落在每個區間中的觀測值的頻率。本質上,箱定義了分隔不同資料值範圍的邊界,直方圖中條形的高度對應於落入每個箱中的資料點的頻率或計數。調整箱的數量或寬度會影響分佈的視覺化方式,可能揭示更多細節或平滑資料的表示。
箱的數量
箱的數量由正整數表示。當未指定 `NumBins` 時,直方圖函式會根據提供的資料自動確定合適的箱數。如果您同時使用 `NumBins`、`BinMethod`、`BinWidth` 或 `BinEdges`,直方圖函式只考慮最後一個引數。
箱的寬度
箱的寬度表示一個正標量值。當您定義 `BinWidth` 時,直方圖最多可以使用 65,536 個箱(或 216)。如果指定的箱寬度需要更多箱,直方圖會調整為更大的箱寬度,以適應最大箱數。對於日期時間和持續時間資料,`BinWidth` 可以是標量持續時間或日曆持續時間。當您同時使用 `BinWidth`、`BinMethod`、`NumBins` 或 `BinEdges` 時,直方圖函式只考慮最後一個引數。
示例 - `histogram(X,'BinWidth',5)` 使用寬度為 5 個單位的箱。
箱的邊緣
箱的邊緣由數值向量定義,其中第一個元素表示第一個箱的起始邊緣,最後一個元素表示最後一個箱的結束邊緣。最後一個邊緣僅考慮最後一個箱。如果沒有指定箱邊緣,直方圖函式會自動計算這些邊緣。如果您同時使用 `BinEdges`、`BinMethod`、`BinWidth`、`NumBins` 或 `BinLimits`,直方圖函式會優先考慮 `BinEdges`,並且它必須是提供的最後一個引數。
箱的限制
箱的限制由一個包含兩個元素的向量 [bmin, bmax] 定義,其中第一個值表示第一個箱的起始邊緣,第二個值表示最後一個箱的結束邊緣。使用這些限制只計算包含在這些箱限制內的(包括邊界)資料,表示為 X>=bmin & X<=bmax。
示例 - `histogram(X,'BinLimits',[1,10])` 只對介於 1 和 10 之間(包括邊界)的值進行分箱。
直方圖中的類別
在 MATLAB 中,當使用直方圖函式處理分類資料時,“類別”指的是要視覺化的分類陣列中的不同組或標籤。為分類資料建立直方圖時,每個唯一類別將具有自己的條形,條形的高度表示該特定類別在資料集中出現的頻率或計數。
包含在直方圖中的類別
直方圖中表示的類別由字元向量的元胞陣列、分類陣列、字串陣列或模式標量定義。
示例 - `h = histogram(C,{'Large','Small'})` 建立一個直方圖,只顯示與類別“Large”和“Small”關聯的分類資料。
建立基本直方圖
MATLAB 中的直方圖函式生成直方圖。這是一個簡單的示例:
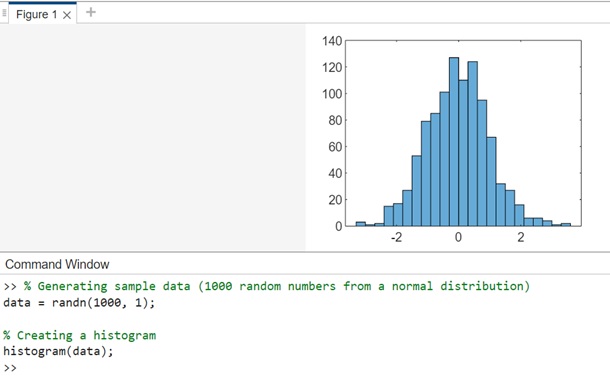
示例 1:建立基本直方圖
這段程式碼根據從標準正態分佈 (randn) 取樣的 1000 個隨機數生成直方圖。直方圖函式會根據資料自動確定合適的箱數。
% Generating sample data (1000 random numbers from a normal distribution)
data = randn(1000, 1);

% Creating a histogram
histogram(data);
在 MATLAB 命令視窗中執行相同的操作,輸出結果為:
讓我們來看另一個類似的例子,如下所示:
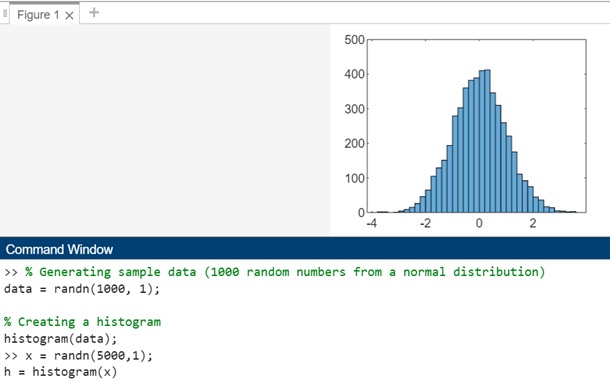
例2:使用直方圖物件查詢直方圖區間
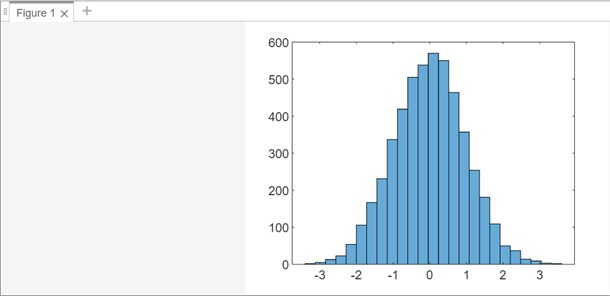
這段程式碼將根據5000個隨機數生成一個直方圖。直方圖函式會自動選擇最佳區間數來涵蓋x中的值範圍,有效地說明了分佈的形式。
x = randn(5000,1);
h = histogram(x)
在Matlab命令視窗中執行後的輸出為:
如果為直方圖函式指定一個輸出,它將提供一個直方圖物件。此物件可以檢查直方圖屬性,例如區間計數或區間寬度。
帶有方法和屬性的直方圖物件如下所示:
>> x = randn(5000,1);
h = histogram(x)


h =

  Histogram with properties:

             Data: [5000x1 double]
           Values: [2 2 0 1 4 9 15 26 46 65 105 129 151 194 279 303 360 382 389 410 412 346 310 260 221 175 111 ... ] (1x37 double)
          NumBins: 37
         BinEdges: [-3.8000 -3.6000 -3.4000 -3.2000 -3 -2.8000 -2.6000 -2.4000 -2.2000 -2 -1.8000 -1.6000 ... ] (1x38 double)
         BinWidth: 0.2000
        BinLimits: [-3.8000 3.6000]
    Normalization: 'count'
        FaceColor: 'auto'
        EdgeColor: [0 0 0]

  Show all properties

            Annotation: [1x1 matlab.graphics.eventdata.Annotation]
          BeingDeleted: off
             BinCounts: [2 2 0 1 4 9 15 26 46 65 105 129 151 194 279 303 360 382 389 410 412 346 310 260 ... ] (1x37 double)
         BinCountsMode: 'auto'
              BinEdges: [-3.8000 -3.6000 -3.4000 -3.2000 -3 -2.8000 -2.6000 -2.4000 -2.2000 -2 -1.8000 ... ] (1x38 double)
             BinLimits: [-3.8000 3.6000]
         BinLimitsMode: 'auto'
             BinMethod: 'auto'
              BinWidth: 0.2000
            BusyAction: 'queue'
         ButtonDownFcn: ''
              Children: [0x0 GraphicsPlaceholder]
           ContextMenu: [0x0 GraphicsPlaceholder]
             CreateFcn: ''
                  Data: [5000x1 double]
       DataTipTemplate: [1x1 matlab.graphics.datatip.DataTipTemplate]
             DeleteFcn: ''
           DisplayName: 'x'
          DisplayStyle: 'bar'
             EdgeAlpha: 1
             EdgeColor: [0 0 0]
             FaceAlpha: 0.6000
             FaceColor: 'auto'
      HandleVisibility: 'on'
               HitTest: on
         Interruptible: on
             LineStyle: '-'
             LineWidth: 0.5000
         Normalization: 'count'
               NumBins: 37
           Orientation: 'vertical'
                Parent: [1x1 Axes]
         PickableParts: 'visible'
              Selected: off
    SelectionHighlight: on
           SeriesIndex: 1
                   Tag: ''
                  Type: 'histogram'
              UserData: []
                Values: [2 2 0 1 4 9 15 26 46 65 105 129 151 194 279 303 360 382 389 410 412 346 310 260 ... ] (1x37 double)
               Visible: on
要查詢直方圖區間的數量,可以執行以下操作:
nbins = h.NumBins
在Matlab命令視窗中執行結果如下:
>> nbins = h.NumBins

nbins =

    37

>>
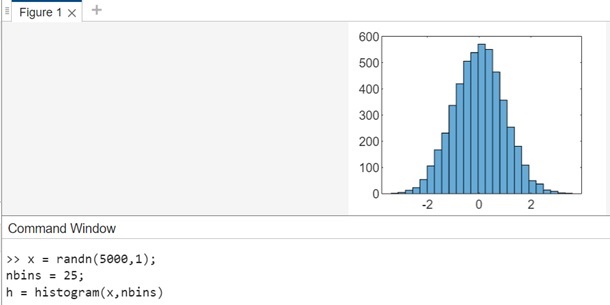
例3
讓我們繪製一個包含5000個隨機數的直方圖,這些隨機數被分成25個等間距的區間。
x = randn(5000,1);
nbins = 25;
h = histogram(x,nbins)
執行後的輸出如下:
讓我們使用以下程式碼查詢區間計數:
counts = h.Values
在Matlab命令視窗中執行後的輸出為:
>> counts = h.Values

counts =

  Columns 1 through 21

     2     5    13    23    54   106   167   231   337   419   505   538   570   550   464   357   254   181   109    50    37

  Columns 22 through 25

    14     9     3     2

>>
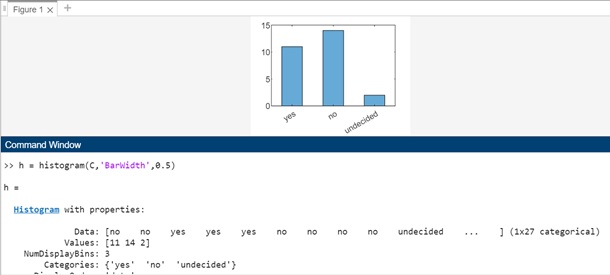
例4:繪製分類直方圖
在這個例子中,我們將生成一個表示投票結果的分類向量。向量中的類別是“是”、“否”或“未決定”。
A = [0 0 1 1 1 0 0 0 0 NaN NaN 1 0 0 0 1 0 1 0 1 0 0 0 1 1 1 1];
C = categorical(A,[1 0 NaN],{'yes','no','undecided'})
在Matlab命令視窗中執行後的輸出為:
>> A = [0 0 1 1 1 0 0 0 0 NaN NaN 1 0 0 0 1 0 1 0 1 0 0 0 1 1 1 1];
C = categorical(A,[1 0 NaN],{'yes','no','undecided'})

C =

  1x27 categorical array

  Columns 1 through 13

     no      no      yes      yes      yes      no      no      no      no      undecided      undecided      yes      no

  Columns 14 through 27

     no      no      yes      no      yes      no      yes      no      no      no      yes      yes      yes      yes

>>
使用分類資料,讓我們繪製投票結果的分類直方圖,使用0.5的相對條形寬度。