- Matlab 教程
- MATLAB - 首頁
- MATLAB - 概述
- MATLAB - 特性
- MATLAB - 環境設定
- MATLAB - 編輯器
- MATLAB - 線上
- MATLAB - 工作區
- MATLAB - 語法
- MATLAB - 變數
- MATLAB - 命令
- MATLAB - 資料型別
- MATLAB - 運算子
- MATLAB - 日期和時間
- MATLAB - 數字
- MATLAB - 隨機數
- MATLAB - 字串和字元
- MATLAB - 文字格式化
- MATLAB - 時間表
- MATLAB - M 檔案
- MATLAB - 冒號表示法
- MATLAB - 資料匯入
- MATLAB - 資料匯出
- MATLAB - 資料歸一化
- MATLAB - 預定義變數
- MATLAB - 決策
- MATLAB - 決策語句
- MATLAB - If End 語句
- MATLAB - If Else 語句
- MATLAB - If…Elseif Else 語句
- MATLAB - 巢狀 If 語句
- MATLAB - Switch 語句
- MATLAB - 巢狀 Switch
- MATLAB - 迴圈
- MATLAB - 迴圈
- MATLAB - For 迴圈
- MATLAB - While 迴圈
- MATLAB - 巢狀迴圈
- MATLAB - Break 語句
- MATLAB - Continue 語句
- MATLAB - End 語句
- MATLAB - 陣列
- MATLAB - 陣列
- MATLAB - 向量
- MATLAB - 轉置運算子
- MATLAB - 陣列索引
- MATLAB - 多維陣列
- MATLAB - 相容陣列
- MATLAB - 分類陣列
- MATLAB - 元胞陣列
- MATLAB - 矩陣
- MATLAB - 稀疏矩陣
- MATLAB - 表格
- MATLAB - 結構體
- MATLAB - 陣列乘法
- MATLAB - 陣列除法
- MATLAB - 陣列函式
- MATLAB - 函式
- MATLAB - 函式
- MATLAB - 函式引數
- MATLAB - 匿名函式
- MATLAB - 巢狀函式
- MATLAB - 返回語句
- MATLAB - 空函式
- MATLAB - 區域性函式
- MATLAB - 全域性變數
- MATLAB - 函式控制代碼
- MATLAB - 濾波函式
- MATLAB - 階乘
- MATLAB - 私有函式
- MATLAB - 子函式
- MATLAB - 遞迴函式
- MATLAB - 函式優先順序順序
- MATLAB - Map 函式
- MATLAB - 均值函式
- MATLAB - End 函式
- MATLAB - 錯誤處理
- MATLAB - 錯誤處理
- MATLAB - Try...Catch 語句
- MATLAB - 除錯
- MATLAB - 繪圖
- MATLAB - 繪圖
- MATLAB - 繪製陣列
- MATLAB - 繪製向量
- MATLAB - 條形圖
- MATLAB - 直方圖
- MATLAB - 圖形
- MATLAB - 2D 線性圖
- MATLAB - 3D 繪圖
- MATLAB - 格式化繪圖
- MATLAB - 對數座標軸繪圖
- MATLAB - 繪製誤差條
- MATLAB - 繪製 3D 等值線圖
- MATLAB - 極座標圖
- MATLAB - 散點圖
- MATLAB - 繪製表示式或函式
- MATLAB - 繪製矩形
- MATLAB - 繪製頻譜圖
- MATLAB - 繪製網格曲面
- MATLAB - 繪製正弦波
- MATLAB - 插值
- MATLAB - 插值
- MATLAB - 線性插值
- MATLAB - 2D 陣列插值
- MATLAB - 3D 陣列插值
- MATLAB - 多項式
- MATLAB - 多項式
- MATLAB - 多項式加法
- MATLAB - 多項式乘法
- MATLAB - 多項式除法
- MATLAB - 多項式的導數
- MATLAB - 變換
- MATLAB - 變換
- MATLAB - 拉普拉斯變換
- MATLAB - 拉普拉斯濾波器
- MATLAB - 高斯-拉普拉斯濾波器
- MATLAB - 逆傅立葉變換
- MATLAB - 傅立葉變換
- MATLAB - 快速傅立葉變換
- MATLAB - 2D 逆餘弦變換
- MATLAB - 向座標軸新增圖例
- MATLAB - 面向物件
- MATLAB - 面向物件程式設計
- MATLAB - 類和物件
- MATLAB - 函式過載
- MATLAB - 運算子過載
- MATLAB - 使用者自定義類
- MATLAB - 複製物件
- MATLAB - 代數
- MATLAB - 線性代數
- MATLAB - 高斯消元法
- MATLAB - 高斯-約旦消元法
- MATLAB - 行最簡形
- MATLAB - 特徵值和特徵向量
- MATLAB - 積分
- MATLAB - 積分
- MATLAB - 二重積分
- MATLAB - 梯形法則
- MATLAB - 辛普森法則
- MATLAB - 雜項
- MATLAB - 微積分
- MATLAB - 微分
- MATLAB - 矩陣的逆
- MATLAB - GNU Octave
- MATLAB - Simulink
- MATLAB - 有用資源
- MATLAB - 快速指南
- MATLAB - 有用資源
- MATLAB - 討論
MATLAB - 3D 繪圖
MATLAB 提供了強大的工具來建立三維視覺化,允許使用者在 3D 空間中表示和探索資料。3D 繪圖對於視覺化複雜資料至關重要,例如曲面、體積和多維資料集。
3D 繪圖型別
- 曲面圖 - 這些使用表示變數之間關係的曲面來視覺化兩個變數的函式。
- 網格圖 - 網格圖顯示線框曲面,對於在網格上視覺化兩個變數的函式很有用。
- 散點圖 - 在 3D 中,散點圖以三個維度表示單個數據點,通常使用不同的符號或顏色來表示不同的屬性。
語法
plot3(X,Y,Z)
plot3(X,Y,Z,LineSpec)
plot3(X1,Y1,Z1,...,Xn,Yn,Zn)
plot3(X1,Y1,Z1,LineSpec1,...,Xn,Yn,Zn,LineSpecn)
plot3(X,Y,Z) - 此方法負責在 3D 空間中繪製 X、Y 和 Z 的座標。
- 要透過線段繪製連線的座標,請確保 X、Y 和 Z 是長度相同的向量。
- 要在單個軸集上視覺化多個座標集,請將 X、Y 或 Z 中的至少一個指定為矩陣,而其餘的保持為向量。
plot3(X,Y,Z,LineSpec) - 此方法繪製具有指定線型、標記和顏色的 3D 圖。
plot3(X1,Y1,Z1,...,Xn,Yn,Zn) - 此方法有助於在同一組軸上繪製多組座標。
plot3(X1,Y1,Z1,LineSpec1,...,Xn,Yn,Zn,LineSpecn) - plot3 函式允許為各個 XYZ 三元組分配不同的線型、標記和顏色。可以為某些三元組指定 LineSpec,而為其他三元組省略。例如,使用 plot3(X1,Y1,Z1,'o',X2,Y2,Z2) 將標記分配給第一個三元組,但不分配給第二個三元組。
根據上面討論的語法,讓我們嘗試一些示例來繪製 3D 圖。
示例 1
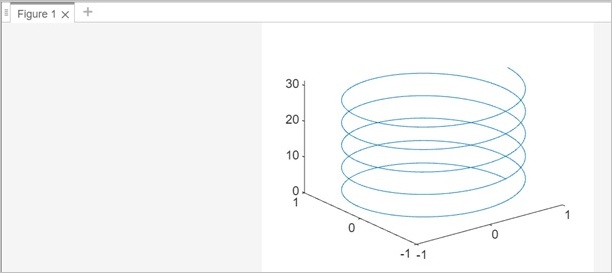
螺旋線可以透過 x、y 和 z 的引數方程生成。螺旋線在柱座標系中的通用方程為 -
以下是一個將使用 plot3(X,Y,Z) 繪製 3D 螺旋線的示例 -
x=r.cos(t)

y=r.sin(t)

z=h.t
其中 r 是螺旋線的半徑,t 是引數,h 表示螺距或螺旋線在一圈完整旋轉中垂直移動的距離。
% Parameters
r = 1;  % Radius
h = 1;  % Pitch
t = 0:0.1:10*pi;  % Parameter range

% Parametric equations for x, y, z
x = r * cos(t);
y = r * sin(t);
z = h * t;

% Plotting the helix
plot3(x, y, z);
當您在 matlab 命令視窗中執行相同操作時,輸出為 -
示例 2
使用上述相同示例,讓我們為 3D 繪圖使用圓形標記
% Parameters
r = 1;  % Radius
h = 1;  % Pitch
t = 0:0.1:10*pi;  % Parameter range

% Parametric equations for x, y, z
x = r * cos(t);
y = r * sin(t);
z = h * t;

% Plotting the helix
plot3(x, y, z, 'o');
當您在 matlab 命令視窗中執行相同操作時,輸出為 -

示例 3
讓我們使用此 plot3(X1,Y1,Z1,...,Xn,Yn,Zn) 繪製 3D 的多條線。
% Define parameters and range
t = 0:0.1:10*pi;  % Parameter range

% Line 1
r1 = 1;  % Radius of the first helix
h1 = 1;  % Pitch of the first helix
x1 = r1 * cos(t);
y1 = r1 * sin(t);
z1 = h1 * t;

% Line 2
r2 = 0.5;  % Radius of the second helix
h2 = 2;    % Pitch of the second helix
x2 = r2 * cos(t);
y2 = r2 * sin(t);
z2 = h2 * t;

% Plotting multiple lines
plot3(x1, y1, z1,x2, y2, z2);
當您在 matlab 中執行相同操作時,輸出如下 -

示例 4
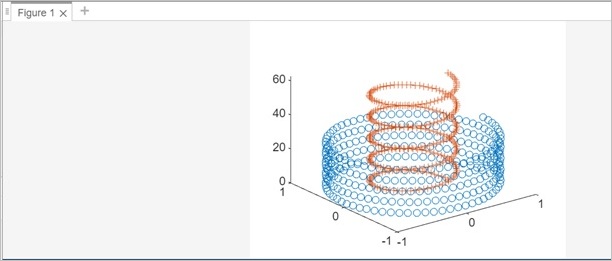
plot3(X1,Y1,Z1,LineSpec1,...,Xn,Yn,Zn,LineSpecn) ,讓我們為多條線 3D 繪圖指定線型。
% Define parameters and range
t = 0:0.1:10*pi;  % Parameter range

% Line 1
r1 = 1;  % Radius of the first helix
h1 = 1;  % Pitch of the first helix
x1 = r1 * cos(t);
y1 = r1 * sin(t);
z1 = h1 * t;

% Line 2
r2 = 0.5;  % Radius of the second helix
h2 = 2;    % Pitch of the second helix
x2 = r2 * cos(t);
y2 = r2 * sin(t);
z2 = h2 * t;

% Plotting multiple lines
plot3(x1, y1, z1,'o',x2, y2, z2,'+');
對於第一條線,我們使用了圓形 (o) 標記,對於第二條線,我們使用了加號 (+) 線型。
程式碼執行後的輸出如下 -
示例 5
在這個示例中,我們將看到標記和線型的自定義。
% Parameters
r = 1;  % Radius
h = 1;  % Pitch
t = 0:0.1:10*pi;  % Parameter range

% Parametric equations for x, y, z
x = r * cos(t);
y = r * sin(t);
z = h * t;

% Plotting the helix
plot3(x, y, z,'-o','Color','b','MarkerSize',10,'MarkerFaceColor','#CFCFCF')
當您在 matlab 命令視窗中執行相同操作時,輸出為 -
