- 機器學習基礎
- ML - 首頁
- ML - 簡介
- ML - 入門
- ML - 基本概念
- ML - 生態系統
- ML - Python 庫
- ML - 應用
- ML - 生命週期
- ML - 必備技能
- ML - 實現
- ML - 挑戰與常見問題
- ML - 限制
- ML - 真實案例
- ML - 資料結構
- ML - 數學基礎
- ML - 人工智慧
- ML - 神經網路
- ML - 深度學習
- ML - 獲取資料集
- ML - 分類資料
- ML - 資料載入
- ML - 資料理解
- ML - 資料準備
- ML - 模型
- ML - 監督學習
- ML - 無監督學習
- ML - 半監督學習
- ML - 強化學習
- ML - 監督學習與無監督學習
- 機器學習資料視覺化
- ML - 資料視覺化
- ML - 直方圖
- ML - 密度圖
- ML - 箱線圖
- ML - 相關矩陣圖
- ML - 散點矩陣圖
- 機器學習統計學
- ML - 統計學
- ML - 均值、中位數、眾數
- ML - 標準差
- ML - 百分位數
- ML - 資料分佈
- ML - 偏度和峰度
- ML - 偏差和方差
- ML - 假設
- ML中的迴歸分析
- ML - 迴歸分析
- ML - 線性迴歸
- ML - 簡單線性迴歸
- ML - 多元線性迴歸
- ML - 多項式迴歸
- ML中的分類演算法
- ML - 分類演算法
- ML - 邏輯迴歸
- ML - K近鄰演算法(KNN)
- ML - 樸素貝葉斯演算法
- ML - 決策樹演算法
- ML - 支援向量機
- ML - 隨機森林
- ML - 混淆矩陣
- ML - 隨機梯度下降
- ML中的聚類演算法
- ML - 聚類演算法
- ML - 基於質心的聚類
- ML - K均值聚類
- ML - K中心點聚類
- ML - 均值漂移聚類
- ML - 層次聚類
- ML - 基於密度的聚類
- ML - DBSCAN聚類
- ML - OPTICS聚類
- ML - HDBSCAN聚類
- ML - BIRCH聚類
- ML - 親和傳播
- ML - 基於分佈的聚類
- ML - 凝聚層次聚類
- ML中的降維
- ML - 降維
- ML - 特徵選擇
- ML - 特徵提取
- ML - 向後剔除法
- ML - 向前特徵構造
- ML - 高相關性過濾器
- ML - 低方差過濾器
- ML - 缺失值比例
- ML - 主成分分析
- 強化學習
- ML - 強化學習演算法
- ML - 利用與探索
- ML - Q學習
- ML - REINFORCE演算法
- ML - SARSA強化學習
- ML - 演員評論家方法
- 深度強化學習
- ML - 深度強化學習
- 量子機器學習
- ML - 量子機器學習
- ML - 使用Python的量子機器學習
- 機器學習雜項
- ML - 效能指標
- ML - 自動化工作流程
- ML - 提升模型效能
- ML - 梯度提升
- ML - 自舉匯聚(Bagging)
- ML - 交叉驗證
- ML - AUC-ROC曲線
- ML - 網格搜尋
- ML - 資料縮放
- ML - 訓練和測試
- ML - 關聯規則
- ML - Apriori演算法
- ML - 高斯判別分析
- ML - 成本函式
- ML - 貝葉斯定理
- ML - 精度和召回率
- ML - 對抗性
- ML - 堆疊
- ML - 輪次
- ML - 感知器
- ML - 正則化
- ML - 過擬合
- ML - P值
- ML - 熵
- ML - MLOps
- ML - 資料洩漏
- ML - 機器學習的貨幣化
- ML - 資料型別
- 機器學習 - 資源
- ML - 快速指南
- ML - 速查表
- ML - 面試問題
- ML - 有用資源
- ML - 討論
機器學習 - 決策樹演算法
決策樹演算法是一種基於層次樹的演算法,用於根據一組規則對結果進行分類或預測。它的工作原理是根據輸入特徵的值將資料分成子集。該演算法遞迴地分割資料,直到到達每個子集中的資料屬於同一類或目標變數具有相同值的地步。生成的樹是一組可以用來預測或對新資料進行分類的決策規則。
決策樹演算法的工作原理是在每個節點選擇最佳特徵來分割資料。最佳特徵是提供最大資訊增益或最大熵減小的特徵。資訊增益是衡量在特定特徵處分割資料所獲得的資訊量,而熵是衡量資料中隨機性或無序性的量度。該演算法使用這些度量來確定在每個節點分割資料的最佳特徵。
下面是一個二叉樹的例子,用於預測一個人是否健康,提供了年齡、飲食習慣和運動習慣等各種資訊:
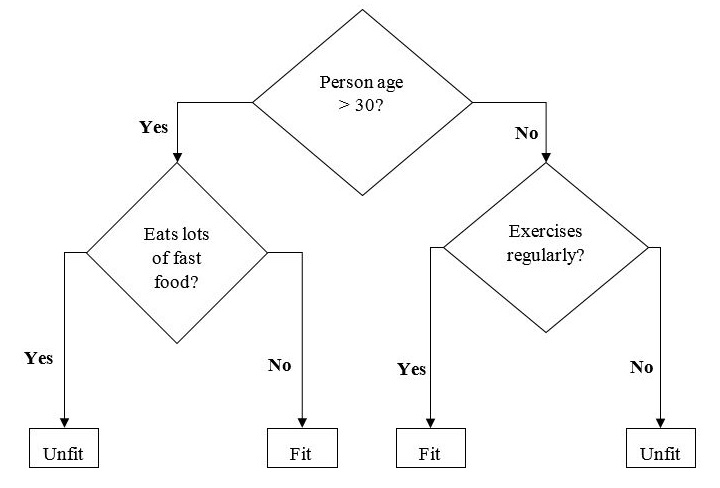
在上圖的決策樹中,問題是決策節點,最終結果是葉子節點。
決策樹演算法的型別
決策樹演算法主要有兩種型別:
分類樹 - 分類樹用於將資料分類到不同的類別或範疇。它的工作原理是根據輸入特徵的值將資料分成子集,並將每個子集分配給不同的類別。
迴歸樹 - 迴歸樹用於預測數值或連續變數。它的工作原理是根據輸入特徵的值將資料分成子集,並將每個子集分配一個數值。
Python實現
讓我們使用一個名為Iris資料集的流行資料集在Python中實現決策樹演算法,用於分類任務。它包含150個鳶尾花樣本,每個樣本具有四個特徵:萼片長度、萼片寬度、花瓣長度和花瓣寬度。這些花屬於三個類別:setosa、versicolor和virginica。
首先,我們將匯入必要的庫並載入資料集:
import numpy as np
from sklearn.datasets import load_iris
from sklearn.model_selection import train_test_split
from sklearn.tree import DecisionTreeClassifier

# Load the iris dataset
iris = load_iris()

# Split the dataset into training and testing sets
X_train, X_test, y_train, y_test = train_test_split(iris.data,
iris.target, test_size=0.3, random_state=0)
然後,我們建立一個決策樹分類器的例項,並在訓練集上對其進行訓練:
# Create a Decision Tree classifier
dtc = DecisionTreeClassifier()

# Fit the classifier to the training data
dtc.fit(X_train, y_train)
現在,我們可以使用訓練好的分類器對測試集進行預測:
# Make predictions on the testing data
y_pred = dtc.predict(X_test)
我們可以透過計算其準確率來評估分類器的效能:
# Calculate the accuracy of the classifier
accuracy = np.sum(y_pred == y_test) / len(y_test)
print("Accuracy:", accuracy)
我們可以使用Matplotlib庫視覺化決策樹:
import matplotlib.pyplot as plt
from sklearn.tree import plot_tree

# Visualize the Decision Tree using Matplotlib
plt.figure(figsize=(20,10))
plot_tree(dtc, filled=True, feature_names=iris.feature_names,
class_names=iris.target_names)
plt.show()
可以使用`sklearn.tree`模組中的`plot_tree`函式來繪製決策樹。我們可以傳入訓練好的決策樹分類器,`filled`引數用於用顏色填充節點,`feature_names`引數用於標記特徵,`class_names`引數用於標記目標類別。我們還指定`figsize`引數來設定圖形的大小,並呼叫`show`函式來顯示繪圖。
完整的實現示例
以下是使用iris資料集在python中實現決策樹分類演算法的完整實現示例:
import numpy as np
from sklearn.datasets import load_iris
from sklearn.model_selection import train_test_split
from sklearn.tree import DecisionTreeClassifier

# Load the iris dataset
iris = load_iris()

# Split the dataset into training and testing sets
X_train, X_test, y_train, y_test = train_test_split(iris.data, iris.target, test_size=0.3, random_state=0)

# Create a Decision Tree classifier
dtc = DecisionTreeClassifier()

# Fit the classifier to the training data
dtc.fit(X_train, y_train)

# Make predictions on the testing data
y_pred = dtc.predict(X_test)

# Calculate the accuracy of the classifier
accuracy = np.sum(y_pred == y_test) / len(y_test)
print("Accuracy:", accuracy)

# Visualize the Decision Tree using Matplotlib
import matplotlib.pyplot as plt
from sklearn.tree import plot_tree
plt.figure(figsize=(20,10))
plot_tree(dtc, filled=True, feature_names=iris.feature_names,
class_names=iris.target_names)
plt.show()
輸出
這將建立一個決策樹圖,如下所示:
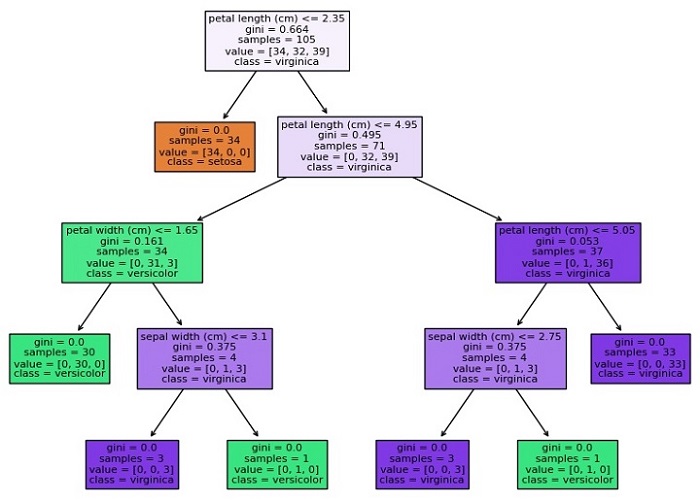
Accuracy: 0.9777777777777777
正如你所看到的,該圖顯示了決策樹的結構,每個節點代表基於特徵值做出的決策,每個葉節點代表一個類別或數值。每個節點的顏色表示該節點中樣本的主要類別或值,底部的數字表示到達該節點的樣本數量。