- Python 基礎
- Python - 首頁
- Python - 概述
- Python - 歷史
- Python - 特性
- Python vs C++
- Python - Hello World 程式
- Python - 應用領域
- Python - 直譯器
- Python - 環境設定
- Python - 虛擬環境
- Python - 基本語法
- Python - 變數
- Python - 資料型別
- Python - 型別轉換
- Python - Unicode 系統
- Python - 字面量
- Python - 運算子
- Python - 算術運算子
- Python - 比較運算子
- Python - 賦值運算子
- Python - 邏輯運算子
- Python - 位運算子
- Python - 成員運算子
- Python - 身份運算子
- Python - 運算子優先順序
- Python - 註釋
- Python - 使用者輸入
- Python - 數字
- Python - 布林值
- Python 控制語句
- Python - 控制流
- Python - 決策
- Python - If 語句
- Python - If else
- Python - 巢狀 If
- Python - Match-Case 語句
- Python - 迴圈
- Python - for 迴圈
- Python - for-else 迴圈
- Python - While 迴圈
- Python - break 語句
- Python - continue 語句
- Python - pass 語句
- Python - 巢狀迴圈
- Python 函式 & 模組
- Python - 函式
- Python - 預設引數
- Python - 關鍵字引數
- Python - 僅關鍵字引數
- Python - 位置引數
- Python - 僅位置引數
- Python - 可變引數
- Python - 變數作用域
- Python - 函式註解
- Python - 模組
- Python - 內建函式
- Python 字串
- Python - 字串
- Python - 字串切片
- Python - 修改字串
- Python - 字串連線
- Python - 字串格式化
- Python - 跳脫字元
- Python - 字串方法
- Python - 字串練習
- Python 列表
- Python - 列表
- Python - 訪問列表元素
- Python - 修改列表元素
- Python - 新增列表元素
- Python - 刪除列表元素
- Python - 迴圈遍歷列表
- Python - 列表推導式
- Python - 排序列表
- Python - 複製列表
- Python - 合併列表
- Python - 列表方法
- Python - 列表練習
- Python 元組
- Python - 元組
- Python - 訪問元組元素
- Python - 更新元組
- Python - 解包元組
- Python - 迴圈遍歷元組
- Python - 合併元組
- Python - 元組方法
- Python - 元組練習
- Python 集合
- Python - 集合
- Python - 訪問集合元素
- Python - 新增集合元素
- Python - 刪除集合元素
- Python - 迴圈遍歷集合
- Python - 合併集合
- Python - 複製集合
- Python - 集合運算子
- Python - 集合方法
- Python - 集合練習
- Python 字典
- Python - 字典
- Python - 訪問字典元素
- Python - 修改字典元素
- Python - 新增字典元素
- Python - 刪除字典元素
- Python - 字典檢視物件
- Python - 迴圈遍歷字典
- Python - 複製字典
- Python - 巢狀字典
- Python - 字典方法
- Python - 字典練習
- Python 陣列
- Python - 陣列
- Python - 訪問陣列元素
- Python - 新增陣列元素
- Python - 刪除陣列元素
- Python - 迴圈遍歷陣列
- Python - 複製陣列
- Python - 反轉陣列
- Python - 排序陣列
- Python - 合併陣列
- Python - 陣列方法
- Python - 陣列練習
- Python 檔案處理
- Python - 檔案處理
- Python - 寫入檔案
- Python - 讀取檔案
- Python - 重新命名和刪除檔案
- Python - 目錄
- Python - 檔案方法
- Python - OS 檔案/目錄方法
- Python - OS 路徑方法
- 面向物件程式設計
- Python - OOPs 概念
- Python - 類 & 物件
- Python - 類屬性
- Python - 類方法
- Python - 靜態方法
- Python - 建構函式
- Python - 訪問修飾符
- Python - 繼承
- Python - 多型
- Python - 方法重寫
- Python - 方法過載
- Python - 動態繫結
- Python - 動態型別
- Python - 抽象
- Python - 封裝
- Python - 介面
- Python - 包
- Python - 內部類
- Python - 匿名類和物件
- Python - 單例類
- Python - 包裝類
- Python - 列舉
- Python - 反射
- Python 錯誤 & 異常
- Python - 語法錯誤
- Python - 異常
- Python - try-except 程式碼塊
- Python - try-finally 程式碼塊
- Python - 丟擲異常
- Python - 異常鏈
- Python - 巢狀 try 程式碼塊
- Python - 使用者定義異常
- Python - 日誌記錄
- Python - 斷言
- Python - 內建異常
- Python 多執行緒
- Python - 多執行緒
- Python - 執行緒生命週期
- Python - 建立執行緒
- Python - 啟動執行緒
- Python - 合併執行緒
- Python - 執行緒命名
- Python - 執行緒排程
- Python - 執行緒池
- Python - 主執行緒
- Python - 執行緒優先順序
- Python - 守護執行緒
- Python - 執行緒同步
- Python 同步
- Python - 執行緒間通訊
- Python - 執行緒死鎖
- Python - 中斷執行緒
- Python 網路程式設計
- Python - 網路程式設計
- Python - 套接字程式設計
- Python - URL 處理
- Python - 泛型
- Python 庫
- NumPy 教程
- Pandas 教程
- SciPy 教程
- Matplotlib 教程
- Django 教程
- OpenCV 教程
- Python 雜項
- Python - 日期 & 時間
- Python - 數學
- Python - 迭代器
- Python - 生成器
- Python - 閉包
- Python - 裝飾器
- Python - 遞迴
- Python - 正則表示式
- Python - PIP
- Python - 資料庫訪問
- Python - 弱引用
- Python - 序列化
- Python - 模板
- Python - 輸出格式化
- Python - 效能測量
- Python - 資料壓縮
- Python - CGI 程式設計
- Python - XML 處理
- Python - GUI 程式設計
- Python - 命令列引數
- Python - 文件字串
- Python - JSON
- Python - 傳送郵件
- Python - 擴充套件
- Python - 工具/實用程式
- Python - GUIs
- Python 高階概念
- Python - 抽象基類
- Python - 自定義異常
- Python - 高階函式
- Python - 物件內部
- Python - 記憶體管理
- Python - 元類
- Python - 使用元類進行超程式設計
- Python - 模擬和存根
- Python - 猴子補丁
- Python - 訊號處理
- Python - 型別提示
- Python - 自動化教程
- Python - Humanize 包
- Python - 上下文管理器
- Python - 協程
- Python - 描述符
- Python - 診斷和修復記憶體洩漏
- Python - 不可變資料結構
- Python 有用資源
- Python - 問答
- Python - 線上測驗
- Python - 快速指南
- Python - 參考
- Python - 速查表
- Python - 專案
- Python - 有用資源
- Python - 討論
- Python 編譯器
- NumPy 編譯器
- Matplotlib 編譯器
- SciPy 編譯器
Python random.gammavariate() 方法
Python 中的 **random.gammavariate()** 方法生成符合 Gamma 分佈 的隨機數。Gamma 分佈是一個雙引數連續機率分佈族,取決於兩個正引數 alpha (α) 和 beta (β) 的值,這兩個引數都必須大於 0。
Gamma 分佈的機率密度函式 (PDF) 為:
         x ** (alpha - 1) * math.exp(-x / beta)
pdf(x) =  --------------------------------------
            math.gamma(alpha) * beta ** alpha
引數 alpha (α) 定義分佈的形狀。較大的 α 值會導致分佈更分散。而引數 beta (β) 定義分佈的尺度。它影響資料點圍繞均值的分佈。
語法
以下是 **gammavariate()** 方法的語法:
random.gammavariate(alpha, beta)
引數
此方法接受以下引數:
**alpha:** 這是 Gamma 分佈的形狀引數,它必須大於 0。
**beta:** 這是 Gamma 分佈的尺度引數,它也必須大於 0。
返回值
此方法返回一個符合 Gamma 分佈的隨機數。
示例 1
讓我們看看使用 **random.gammavariate()** 方法從形狀引數為 2 和尺度引數為 3 的 Gamma 分佈中生成隨機數的基本示例。
import random

# Parameters for the gamma distribution
alpha = 2
beta = 3

# Generate a gamma-distributed random number
random_number = random.gammavariate(alpha, beta)

print("Generated random number:", random_number)
以下是輸出:
Generated random number from gamma distribution: 7.80586421115812
**注意:**由於其隨機性,每次執行程式時生成的輸出都會有所不同。
示例 2
此示例使用此方法生成一個包含 10 個隨機數的列表,這些隨機數服從 Gamma 分佈。
import random

# Parameters for the gamma distribution
alpha = 3
beta = 1.5

result = []
# Generate a random numbers from the gamma distribution
for i in range(10):
    result.append(random.gammavariate(alpha, beta))

print("List of random numbers from Gamma distribution:", result)
執行以上程式碼時,您將獲得如下所示的類似輸出:
List of random numbers from Gamma distribution: [1.8459995636263633, 1.5884068672272527, 2.472844073811172, 5.9912332880010375, 5.710796196794566, 7.0073286403252535, 0.6174810186947404, 2.3729043573117172, 3.5488507756541923, 4.851207589108078]
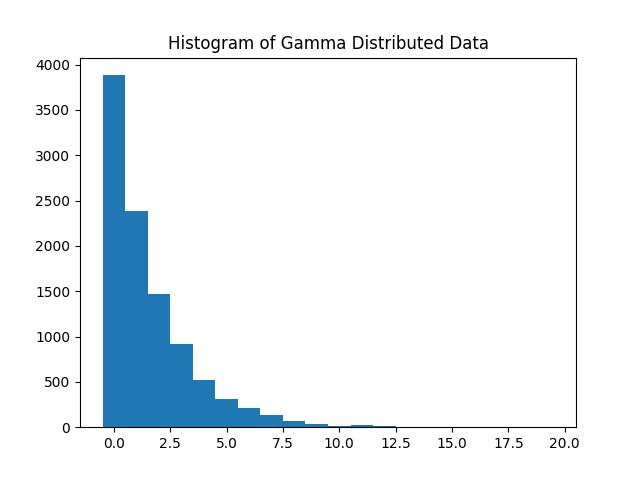
示例 3
以下是一個使用random.gammavariate()方法生成並顯示直方圖的示例,該直方圖顯示了 Gamma 分佈資料的分佈情況。
import random
import numpy as np
import matplotlib.pyplot as plt

# Parameters for the gamma distribution
alpha = 1
beta = 2

# Generate gamma-distributed data
d = [random.gammavariate(alpha, beta) for _ in range(10000)]

# Create a histogram from the generated data, with bins up to the maximum value in d
h, b = np.histogram(d, bins=np.arange(0, max(d)+1))

# Plot the histogram to visualize the distribution
plt.bar(b[:-1], h, width=1, edgecolor='none')
plt.title('Histogram of Gamma Distributed Data')

# Display the plot
plt.show()
以上程式碼的輸出如下:
python_modules.htm
廣告