- Python 基礎
- Python - 首頁
- Python - 概述
- Python - 歷史
- Python - 特性
- Python vs C++
- Python - Hello World 程式
- Python - 應用領域
- Python - 直譯器
- Python - 環境設定
- Python - 虛擬環境
- Python - 基本語法
- Python - 變數
- Python - 資料型別
- Python - 型別轉換
- Python - Unicode 系統
- Python - 字面量
- Python - 運算子
- Python - 算術運算子
- Python - 比較運算子
- Python - 賦值運算子
- Python - 邏輯運算子
- Python - 位運算子
- Python - 成員運算子
- Python - 身份運算子
- Python - 運算子優先順序
- Python - 註釋
- Python - 使用者輸入
- Python - 數字
- Python - 布林值
- Python 控制語句
- Python - 控制流
- Python - 決策
- Python - if 語句
- Python - if else
- Python - 巢狀 if
- Python - match-case 語句
- Python - 迴圈
- Python - for 迴圈
- Python - for-else 迴圈
- Python - while 迴圈
- Python - break 語句
- Python - continue 語句
- Python - pass 語句
- Python - 巢狀迴圈
- Python 函式 & 模組
- Python - 函式
- Python - 預設引數
- Python - 關鍵字引數
- Python - 僅限關鍵字引數
- Python - 位置引數
- Python - 僅限位置引數
- Python - 可變引數
- Python - 變數作用域
- Python - 函式註解
- Python - 模組
- Python - 內建函式
- Python 字串
- Python - 字串
- Python - 字串切片
- Python - 修改字串
- Python - 字串連線
- Python - 字串格式化
- Python - 跳脫字元
- Python - 字串方法
- Python - 字串練習
- Python 列表
- Python - 列表
- Python - 訪問列表項
- Python - 修改列表項
- Python - 新增列表項
- Python - 刪除列表項
- Python - 列表迴圈
- Python - 列表推導式
- Python - 排序列表
- Python - 複製列表
- Python - 合併列表
- Python - 列表方法
- Python - 列表練習
- Python 元組
- Python - 元組
- Python - 訪問元組項
- Python - 更新元組
- Python - 解包元組
- Python - 元組迴圈
- Python - 合併元組
- Python - 元組方法
- Python - 元組練習
- Python 集合
- Python - 集合
- Python - 訪問集合項
- Python - 新增集合項
- Python - 刪除集合項
- Python - 集合迴圈
- Python - 合併集合
- Python - 複製集合
- Python - 集合運算子
- Python - 集合方法
- Python - 集合練習
- Python 字典
- Python - 字典
- Python - 訪問字典項
- Python - 修改字典項
- Python - 新增字典項
- Python - 刪除字典項
- Python - 字典檢視物件
- Python - 字典迴圈
- Python - 複製字典
- Python - 巢狀字典
- Python - 字典方法
- Python - 字典練習
- Python 陣列
- Python - 陣列
- Python - 訪問陣列項
- Python - 新增陣列項
- Python - 刪除陣列項
- Python - 陣列迴圈
- Python - 複製陣列
- Python - 反轉陣列
- Python - 排序陣列
- Python - 合併陣列
- Python - 陣列方法
- Python - 陣列練習
- Python 檔案處理
- Python - 檔案處理
- Python - 寫入檔案
- Python - 讀取檔案
- Python - 檔案重新命名和刪除
- Python - 目錄
- Python - 檔案方法
- Python - OS 檔案/目錄方法
- Python - OS 路徑方法
- 面向物件程式設計
- Python - OOPs 概念
- Python - 類 & 物件
- Python - 類屬性
- Python - 類方法
- Python - 靜態方法
- Python - 建構函式
- Python - 訪問修飾符
- Python - 繼承
- Python - 多型
- Python - 方法重寫
- Python - 方法過載
- Python - 動態繫結
- Python - 動態型別
- Python - 抽象
- Python - 封裝
- Python - 介面
- Python - 包
- Python - 內部類
- Python - 匿名類和物件
- Python - 單例類
- Python - 包裝器類
- Python - 列舉
- Python - 反射
- Python 錯誤 & 異常
- Python - 語法錯誤
- Python - 異常
- Python - try-except 塊
- Python - try-finally 塊
- Python - 丟擲異常
- Python - 異常鏈
- Python - 巢狀 try 塊
- Python - 使用者自定義異常
- Python - 日誌記錄
- Python - 斷言
- Python - 內建異常
- Python 多執行緒
- Python - 多執行緒
- Python - 執行緒生命週期
- Python - 建立執行緒
- Python - 啟動執行緒
- Python - 連線執行緒
- Python - 執行緒命名
- Python - 執行緒排程
- Python - 執行緒池
- Python - 主執行緒
- Python - 執行緒優先順序
- Python - 守護執行緒
- Python - 執行緒同步
- Python 同步
- Python - 執行緒間通訊
- Python - 執行緒死鎖
- Python - 中斷執行緒
- Python 網路程式設計
- Python - 網路程式設計
- Python - 套接字程式設計
- Python - URL 處理
- Python - 泛型
- Python 庫
- NumPy 教程
- Pandas 教程
- SciPy 教程
- Matplotlib 教程
- Django 教程
- OpenCV 教程
- Python 雜項
- Python - 日期 & 時間
- Python - 數學
- Python - 迭代器
- Python - 生成器
- Python - 閉包
- Python - 裝飾器
- Python - 遞迴
- Python - 正則表示式
- Python - PIP
- Python - 資料庫訪問
- Python - 弱引用
- Python - 序列化
- Python - 模板
- Python - 輸出格式化
- Python - 效能測量
- Python - 資料壓縮
- Python - CGI 程式設計
- Python - XML 處理
- Python - GUI 程式設計
- Python - 命令列引數
- Python - 文件字串
- Python - JSON
- Python - 傳送郵件
- Python - 擴充套件
- Python - 工具/實用程式
- Python - GUIs
- Python 高階概念
- Python - 抽象基類
- Python - 自定義異常
- Python - 高階函式
- Python - 物件內部機制
- Python - 記憶體管理
- Python - 元類
- Python - 使用元類進行超程式設計
- Python - 模擬和存根
- Python - Monkey Patching
- Python - 訊號處理
- Python - 型別提示
- Python - 自動化教程
- Python - Humanize 包
- Python - 上下文管理器
- Python - 協程
- Python - 描述符
- Python - 診斷和修復記憶體洩漏
- Python - 不可變資料結構
- Python 有用資源
- Python - 問答
- Python - 線上測驗
- Python - 快速指南
- Python - 參考
- Python - 速查表
- Python - 專案
- Python - 有用資源
- Python - 討論
- Python 編譯器
- NumPy 編譯器
- Matplotlib 編譯器
- SciPy 編譯器
Python random.gauss() 方法
Python 中的random.gauss()方法生成服從高斯分佈(也稱為正態分佈)的隨機數。它是一族連續機率分佈,取決於兩個引數mu和sigma的值。其中,mu是高斯分佈的均值,sigma是高斯分佈的標準差。這種分佈經常用於統計學、資料分析和各個科學領域,包括自然科學和社會科學。
此方法比random.normalvariate()方法更快,後者用於從高斯(正態)分佈生成隨機數。
語法
以下是 Python random.gauss()方法的語法:
random.gauss(mu, sigma)
引數
此方法接受以下引數:
mu: 這是高斯分佈的均值。它定義了資料點分佈的中心。
sigma: 這是高斯分佈的標準差。它決定了分佈的散佈;較大的標準差會導致較寬的分佈。
返回值
此方法返回一個服從高斯分佈的隨機數。
示例 1
讓我們來看一個使用 Python random.gauss()方法從均值為 0、標準差為 1 的高斯分佈生成隨機數的基本示例。
import random

# mean
mu = 0
# standard deviation
sigma = 1

# Generate a Gaussian-distributed random number
random_number = random.gauss(mu, sigma)

# Print the output
print("Generated random number from Gaussian-distribution:",random_number)
以下是輸出:
Generated random number from Gaussian-distribution: 0.5822883447626581
注意:由於其隨機性,每次執行程式生成的輸出都會有所不同。
示例 2
此示例使用random.gauss()方法生成一個包含 10 個服從高斯分佈的隨機數的列表。
import random

# mean
mu = -2

# standard deviation
sigma = 0.5

result = []
# Generate a list of random numbers from the Gaussian distribution
for i in range(10):
    result.append(random.gauss(mu, sigma))

print("List of random numbers from Gaussian distribution:", result)
執行上述程式碼時,您將獲得如下所示的類似輸出:
List of random numbers from Gaussian distribution: [-1.6883491787714924, -2.2670950449189835, -1.68497316636885, -2.62956757323328, -1.8888429377204585, -2.6139116413700765, -2.287545626016553, -1.5470101615690448, -2.259090829777413, -1.9380772732164955]
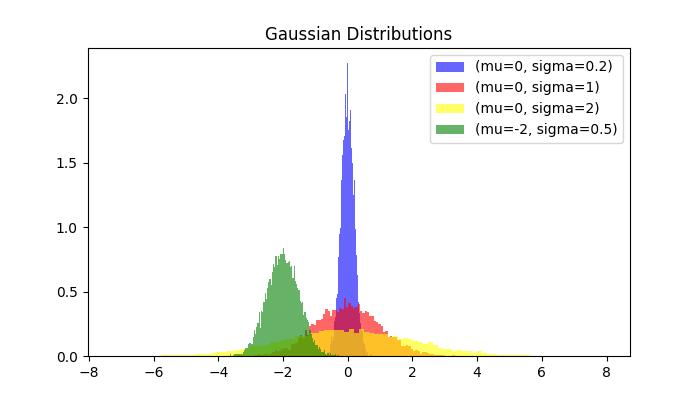
示例 3
這是一個使用random.gauss()方法的另一個示例,它演示瞭如何改變均值和標準差會影響高斯分佈的形狀。
import random
import matplotlib.pyplot as plt

# Define a function to generate and plot data for a given mu and sigma
def plot_gaussian(mu, sigma, label, color):

    # Generate Gaussian-distributed data
    data = [random.gauss(mu, sigma) for _ in range(10000)]

    # Plot histogram of the generated data
    plt.hist(data, bins=100, density=True, alpha=0.6, color=color, label=f'(mu={mu}, sigma={sigma})')

fig = plt.figure(figsize=(7, 4))

# Plotting for each set of parameters
plot_gaussian(0, 0.2, '0, 0.2', 'blue')
plot_gaussian(0, 1, '0, 1', 'red')
plot_gaussian(0, 2, '0, 2', 'yellow')
plot_gaussian(-2, 0.5, '-2, 0.5', 'green')

# Adding labels and title
plt.title('Gaussian Distributions')
plt.legend()

# Show plot
plt.show()
上述程式碼的輸出如下所示:
python_modules.htm
廣告