- Angular 教程
- Angular - 首頁
- Angular - 概述
- Angular - 特性
- Angular - 優點與缺點
- Angular 基礎
- Angular - 環境設定
- Angular - 第一個應用
- Angular - MVC 架構
- Angular 元件
- Angular - 元件
- Angular - 元件生命週期
- Angular - 檢視封裝
- Angular - 元件互動
- Angular - 元件樣式
- Angular - 巢狀元件
- Angular - 內容投影
- Angular - 動態元件
- Angular - 元素
- Angular 模板
- Angular - 模板
- Angular - 文字插值
- Angular - 模板語句
- Angular - 模板中的變數
- Angular - SVG 作為模板
- Angular 繫結
- Angular - 繫結及其型別
- Angular - 資料繫結
- Angular - 事件繫結
- Angular - 屬性繫結
- Angular - 屬性繫結
- Angular - 類和樣式繫結
- Angular 指令
- Angular - 指令
- Angular - 內建指令
- Angular 管道
- Angular - 管道
- Angular - 使用管道轉換資料
- Angular 依賴注入
- Angular - 依賴注入
- Angular HTTP 客戶端程式設計
- Angular - 服務
- Angular - HTTP 客戶端
- Angular - 請求
- Angular - 響應
- Angular - 獲取
- Angular - PUT
- Angular - DELETE
- Angular - JSON-P
- Angular - 使用 HTTP 進行 CRUD 操作
- Angular 路由
- Angular - 路由
- Angular - 導航
- Angular - Angular Material
- Angular 動畫
- Angular - 動畫
- Angular 表單
- Angular - 表單
- Angular - 表單驗證
- Angular Service Workers 和 PWA
- Angular - Service Workers 和 PWA
- Angular 測試
- Angular - 測試概述
- Angular NgModules
- Angular - 模組介紹
- Angular 高階
- Angular - 身份驗證和授權
- Angular - 國際化
- Angular - 可訪問性
- Angular - Web Workers
- Angular - 伺服器端渲染
- Angular - Ivy 編譯器
- Angular - 使用 Bazel 構建
- Angular - 向後相容性
- Angular - 響應式程式設計
- Angular - 指令和元件之間共享資料
- Angular 工具
- Angular - CLI
- Angular 雜項
- Angular - 第三方控制元件
- Angular - 配置
- Angular - 顯示資料
- Angular - 裝飾器和元資料
- Angular - 基本示例
- Angular - 錯誤處理
- Angular - 測試和構建專案
- Angular - 生命週期鉤子
- Angular - 使用者輸入
- Angular - 有什麼新變化?
- Angular 有用資源
- Angular - 快速指南
- Angular - 有用資源
- Angular - 討論
Angular - SVG 作為模板
SVG 提供了一個使用宣告式程式設計建立豐富圖形的框架。Angular 模板可以應用於 SVG,以最小的努力建立動態圖形。
在本節中,讓我們學習如何使用 Angular 模板在 SVG 中建立動態圖表。
動態條形圖
讓我們在 SVG 格式中建立一個簡單的條形圖,並在我們的模板中使用它,然後透過模板輸入變數動態更新條形圖。
步驟 1: 使用 Angular CLI 建立一個新應用程式,如下所示 -
$ ng new my-app
步驟 2: 使用 Angular CLI 建立一個名為 chart 的元件,如下所示 -
$ ng generate component chart
CREATE src/app/chart/chart.component.css (0 bytes)
CREATE src/app/chart/chart.component.html (20 bytes)
CREATE src/app/chart/chart.component.spec.ts (552 bytes)
CREATE src/app/chart/chart.component.ts (198 bytes)
UPDATE src/app/app.module.ts (835 bytes)
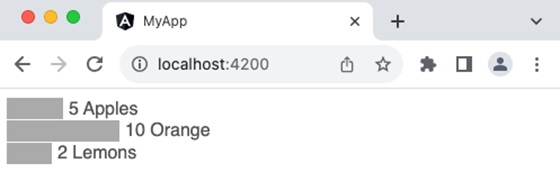
步驟 3: 接下來,開啟元件模板檔案 chart.component.html 並新增一個靜態條形圖到 SVG 中。
<svg class="chart" width="420" height="150">
   <title id="title">Bar chart</title>
   <desc id="desc">Fruits count</desc>
   <g class="bar">
      <rect width="50" height="19"></rect>
      <text x="55" y="9.5" dy=".35em">5 Apples</text>
   </g>
   <g class="bar">
      <rect width="100" height="19" y="20"></rect>
      <text x="105" y="28" dy=".35em">10 Orange</text>
   </g>
   <g class="bar">
      <rect width="40" height="19" y="40"></rect>
      <text x="45" y="48" dy=".35em">2 Lemons</text>
  </g>
</svg>
步驟 4: 接下來,開啟元件的樣式檔案 chart.component.css 並新增以下 CSS 來設定 SVG 條形圖的樣式。
.bar {
   fill: red;
   height: 21px;
   transition: fill .3s ease;
   cursor: pointer;
   font-family: Helvetica, sans-serif;
}
.bar text {
   color: black;
}
.bar:hover,
.bar:focus {
   fill: black;
}
.bar:hover text,
.bar:focus text {
   fill: red;
步驟 5: 接下來,開啟應用程式元件模板 app.component.html 並新增我們的 chart 元件
<app-chart />
步驟 6: 執行應用程式並檢查圖表是否已正確渲染
步驟 7: 接下來,建立一個名為 Fruit 的介面來儲存圖表資料
$ ng generate interface Fruit
CREATE src/app/fruit.ts (27 bytes)
步驟 8: 使用名稱和數量值更新介面
export interface Fruit {
   name: string;
   count: number;
}
步驟 9: 在 chart 元件中匯入 Fruit 介面
import { Fruit } from '../fruit'
步驟 10: 在 chart 元件中新增示例水果資料
fruits : Fruit[] = [
   {
      name: 'Apple',
      count: 10
   },
   {
      name: 'Orange',
      count: 20
   },
   {
      name: 'Lemon',
      count: 5
   }
]
步驟 11: 元件的完整列表如下 -
import { Component } from '@angular/core';
import { Fruit } from '../fruit'

@Component({
   selector: 'app-chart',
   templateUrl: './chart.component.html',
   styleUrls: ['./chart.component.css']
})
export class ChartComponent {
   fruits : Fruit[] = [
   {
      name: 'Apple',
      count: 10
   },
   {
      name: 'Orange',
      count: 20
   },
   {
      name: 'Lemon',
      count: 5
   }
   ]
}
步驟 12: 接下來,開啟元件的模板檔案並更新條形圖以使用來自元件的 fruit 模板變數,如下所示 -
<svg class="chart" width="420" height="150">
   <g class="bar" *ngFor="let fruit of fruits; let i = index;">
      <rect [attr.width]="fruit.count * 10" height="19" [attr.y]="0 + (i * 20)"></rect>
      <text [attr.x]="fruit.count * 10 + 5" [attr.y]="10 + (i * 20)" dy=".35em">
         {{ fruit.count }} {{ fruit.name }}
      </text>
   </g>
</svg>
這裡,
ngFor(結構指令)用於迴圈遍歷 fruits
屬性繫結([attr.width]、[attr.x] 和 [attr-y])與模板語句一起使用,根據 fruits 模板變數動態新增圖表中的每個條形。
fruit.count * 10 是一個模板語句,它根據水果數量設定條形的寬度。
0 + (i * 20) 是另一個模板語句,它設定圖表中條形的位置。
fruit.count * 10 + 5 是另一個模板語句,它設定圖表中條形末端文字的 x 座標。
10 + (i * 20) 是另一個模板語句,它設定圖表中條形末端文字的 y 座標。
步驟 13: 執行應用程式並檢查圖表是否已正確渲染

總結
SVG 圖形可以透過 Angular 模板輕鬆完成。我們可以將其與表單程式設計結合起來,動態設定條形圖的樣式,並擴充套件條形圖以支援其他型別的圖表。SVG 圖表只是一個示例,說明如何在 Angular 模板中建立/操作 SVG。它可以用來建立高階 SVG 圖形,如地圖、基於 SVG 的動畫等。