- R 教程
- R - 首頁
- R - 概述
- R - 環境設定
- R - 基本語法
- R - 資料型別
- R - 變數
- R - 運算子
- R - 決策
- R - 迴圈
- R - 函式
- R - 字串
- R - 向量
- R - 列表
- R - 矩陣
- R - 陣列
- R - 因子
- R - 資料框
- R - 包
- R - 資料重塑
R - 箱線圖
箱線圖是衡量資料集中的資料分佈情況的一種方法。它將資料集劃分為三個四分位數。此圖形表示資料集中的最小值、最大值、中位數、第一四分位數和第三四分位數。它也有助於透過繪製每個資料集的箱線圖來比較跨資料集的資料分佈。
箱線圖在 R 中使用 **boxplot()** 函式建立。
語法
在 R 中建立箱線圖的基本語法如下:
boxplot(x, data, notch, varwidth, names, main)
以下是所用引數的描述:
**x** 是一個向量或公式。
**data** 是資料框。
**notch** 是邏輯值。設定為 TRUE 以繪製凹口。
**varwidth** 是邏輯值。設定為 true 以繪製與樣本大小成比例的框寬度。
**names** 是將在每個箱線圖下方列印的組標籤。
**main** 用於為圖形新增標題。
示例
我們使用 R 環境中可用的資料集“mtcars”來建立基本箱線圖。讓我們看看 mtcars 中的“mpg”和“cyl”列。
input <- mtcars[,c('mpg','cyl')]
print(head(input))
當我們執行以上程式碼時,它會產生以下結果:
                   mpg  cyl
Mazda RX4         21.0   6
Mazda RX4 Wag     21.0   6
Datsun 710        22.8   4
Hornet 4 Drive    21.4   6
Hornet Sportabout 18.7   8
Valiant           18.1   6
建立箱線圖
以下指令碼將為 mpg(每加侖英里數)和 cyl(氣缸數)之間的關係建立一個箱線圖。
# Give the chart file a name.
png(file = "boxplot.png")

# Plot the chart.
boxplot(mpg ~ cyl, data = mtcars, xlab = "Number of Cylinders",
   ylab = "Miles Per Gallon", main = "Mileage Data")

# Save the file.
dev.off()
當我們執行以上程式碼時,它會產生以下結果:

帶凹口的箱線圖
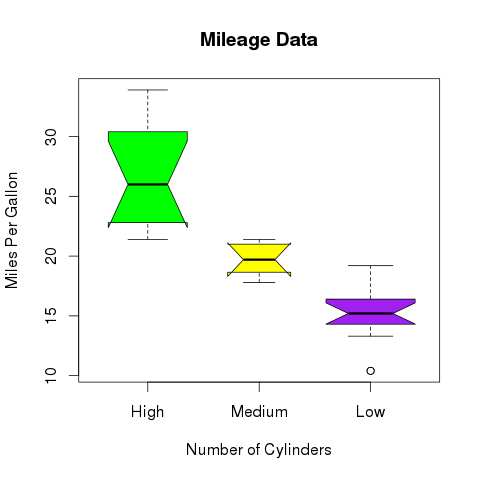
我們可以繪製帶凹口的箱線圖來找出不同資料組的中位數如何相互匹配。
以下指令碼將為每個資料組建立一個帶凹口的箱線圖。
# Give the chart file a name.
png(file = "boxplot_with_notch.png")

# Plot the chart.
boxplot(mpg ~ cyl, data = mtcars,
   xlab = "Number of Cylinders",
   ylab = "Miles Per Gallon",
   main = "Mileage Data",
   notch = TRUE,
   varwidth = TRUE,
   col = c("green","yellow","purple"),
   names = c("High","Medium","Low")
)
# Save the file.
dev.off()
當我們執行以上程式碼時,它會產生以下結果:
廣告