- R 教程
- R - 首頁
- R - 概述
- R - 環境設定
- R - 基本語法
- R - 資料型別
- R - 變數
- R - 運算子
- R - 決策
- R - 迴圈
- R - 函式
- R - 字串
- R - 向量
- R - 列表
- R - 矩陣
- R - 陣列
- R - 因子
- R - 資料框
- R - 包
- R - 資料重塑
R - 二項分佈
二項分佈模型用於計算在多次實驗中,只有兩種可能結果的事件成功的機率。例如,拋硬幣總是得到正面或反面。二項分佈用於估計在連續拋擲硬幣 10 次中恰好得到 3 個正面的機率。
R 有四個內建函式可以生成二項分佈。它們描述如下。
dbinom(x, size, prob)
pbinom(x, size, prob)
qbinom(p, size, prob)
rbinom(n, size, prob)
以下是所用引數的描述:
x 是一個數字向量。
p 是一個機率向量。
n 是觀測數。
size 是試驗次數。
prob 是每次試驗成功的機率。
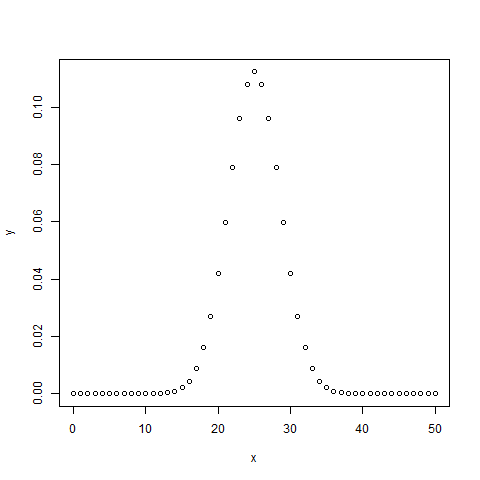
dbinom()
此函式給出每個點的機率密度分佈。
# Create a sample of 50 numbers which are incremented by 1.
x <- seq(0,50,by = 1)

# Create the binomial distribution.
y <- dbinom(x,50,0.5)

# Give the chart file a name.
png(file = "dbinom.png")

# Plot the graph for this sample.
plot(x,y)

# Save the file.
dev.off()
當我們執行上述程式碼時,它會產生以下結果:
pbinom()
此函式給出事件的累積機率。它是一個表示機率的單個值。
# Probability of getting 26 or less heads from a 51 tosses of a coin.
x <- pbinom(26,51,0.5)

print(x)
當我們執行上述程式碼時,它會產生以下結果:
[1] 0.610116
qbinom()
此函式取機率值並給出一個其累積值與機率值匹配的數字。
# How many heads will have a probability of 0.25 will come out when a coin
# is tossed 51 times.
x <- qbinom(0.25,51,1/2)

print(x)
當我們執行上述程式碼時,它會產生以下結果:
[1] 23
rbinom()
此函式根據給定樣本生成給定機率的所需數量的隨機值。
# Find 8 random values from a sample of 150 with probability of 0.4.
x <- rbinom(8,150,.4)

print(x)
當我們執行上述程式碼時,它會產生以下結果:
[1] 58 61 59 66 55 60 61 67
廣告