- Bokeh 教程
- Bokeh - 主頁
- Bokeh - 介紹
- Bokeh - 環境設定
- Bokeh - 入門
- Bokeh - Jupyter Notebook
- Bokeh - 基本概念
- Bokeh - 含字形圖的繪圖
- Bokeh - 區域繪圖
- Bokeh - 圓形字形圖
- Bokeh - 矩形、橢圓形和多邊形
- Bokeh - 扇形和圓弧
- Bokeh - 專業曲線
- Bokeh - 設定範圍
- Bokeh - 座標軸
- Bokeh - 註釋和圖例
- Bokeh - Pandas
- Bokeh - ColumnDataSource
- Bokeh - 過濾資料
- Bokeh - 佈局
- Bokeh - 繪圖工具
- Bokeh - 樣式化視覺屬性
- Bokeh - 自定義圖例
- Bokeh - 新增小工具
- Bokeh - 伺服器
- Bokeh - 使用 Bokeh 子命令
- Bokeh - 匯出繪圖
- Bokeh - 嵌入繪圖和應用
- Bokeh - 擴充套件 Bokeh
- Bokeh - WebGL
- Bokeh - 使用 JavaScript 開發
- Bokeh 實用資源
- Bokeh - 快速指南
- Bokeh - 實用資源
- Bokeh - 討論
Bokeh - Pandas
在以上所有示例中,用於繪圖的資料已以 Python 列表或 numpy 陣列的形式提供。也可以將資料來源以 pandas DataFrame 物件的形式提供。
DataFrame 是二維資料結構。資料框架中的列可以是不同資料型別的。Pandas 庫具有從各種來源(如 CSV 檔案、Excel 工作表、SQL 表等)建立資料框架的功能。
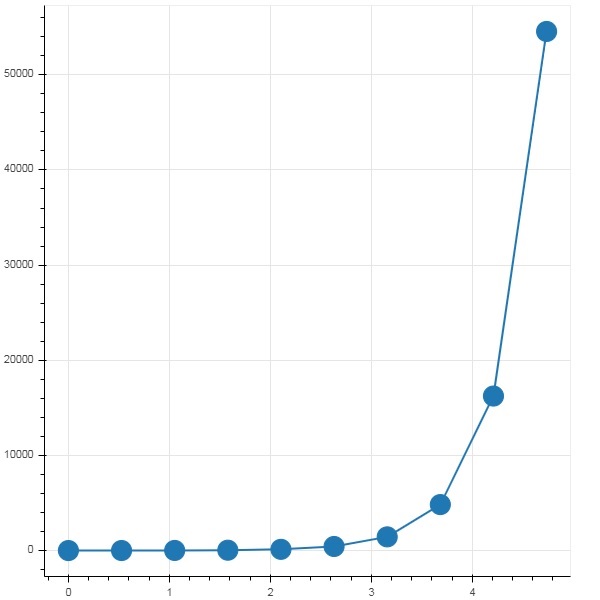
為了便於以下示例,我們使用了一個 CSV 檔案,該檔案包含表示一個數字 x 和 10x 的兩個列。test.csv 檔案如下 −
x,pow
0.0,1.0
0.5263157894736842,3.3598182862837818
1.0526315789473684,11.28837891684689
1.5789473684210527,37.926901907322495
2.1052631578947367,127.42749857031335
2.631578947368421,428.1332398719391
3.1578947368421053,1438.449888287663
3.6842105263157894,4832.930238571752
4.2105263157894735,16237.76739188721
4.7368421052631575,54555.947811685146
我們將在資料框架物件中使用 pandas 中的 read_csv() 函式讀取此檔案。
import pandas as pd
df = pd.read_csv('test.csv')
print (df)
資料框架如下 −
x        pow
0 0.000000 1.000000
1 0.526316 3.359818
2 1.052632 11.288379
3 1.578947 37.926902
4 2.105263 127.427499
5 2.631579 428.133240
6 3.157895 1438.449888
7 3.684211 4832.930239
8 4.210526 16237.767392
9 4.736842 54555.947812
'x' 和 'pow' 列用作 bokeh 繪圖圖形中的折線字形圖的資料序列。
from bokeh.plotting import figure, output_file, show
p = figure()
x = df['x']
y = df['pow']
p.line(x,y,line_width = 2)
p.circle(x, y,size = 20)
show(p)
輸出
廣告