- Bokeh 教程
- Bokeh - 主頁
- Bokeh - 簡介
- Bokeh - 環境設定
- Bokeh - 初學者指南
- Bokeh - Jupyter 筆記型電腦
- Bokeh - 基本概念
- Bokeh - 帶有字形的圖表
- Bokeh - 面積圖
- Bokeh - 圓形字形
- Bokeh - 矩形、橢圓和多邊形
- Bokeh - 扇形和圓弧
- Bokeh - 特殊曲線
- Bokeh - 設定範圍
- Bokeh - 座標軸
- Bokeh - 標註和圖例
- Bokeh - Pandas
- Bokeh - ColumnDataSource
- Bokeh - 篩選資料
- Bokeh - 佈局
- Bokeh - 繪圖工具
- Bokeh - 設定視覺屬性樣式
- Bokeh - 自定圖例
- Bokeh - 新增視窗小部件
- Bokeh - 伺服器
- Bokeh - 使用 Bokeh 子命令
- Bokeh - 匯出圖表
- Bokeh - 嵌入圖表和應用程式
- Bokeh - 擴充套件 Bokeh
- Bokeh - WebGL
- Bokeh - 使用 JavaScript 開發
- Bokeh 有用資源
- Bokeh - 快速指南
- Bokeh - 有用資源
- Bokeh - 討論
Bokeh - 初學者指南
在兩個 numpy 陣列之間建立簡單的折線圖非常簡單。首先,從 bokeh.plotting 模組匯入以下函式 -
from bokeh.plotting import figure, output_file, show
figure() 函式建立一個新的圖形用於繪圖。
output_file() 函式用於指定一個 HTML 檔案來儲存輸出。
show() 函式在瀏覽器或筆記型電腦中顯示 Bokeh 圖形。
接下來,設定兩個 numpy 陣列,其中第二個陣列是第一個陣列的正弦值。
import numpy as np
import math
x = np.arange(0, math.pi*2, 0.05)
y = np.sin(x)
要獲取一個 Bokeh 圖形物件,請指定標題以及 x 和 y 軸標籤,如下所示 -
p = figure(title = "sine wave example", x_axis_label = 'x', y_axis_label = 'y')
圖形物件包含一個 line() 方法,該方法將一個線條字形新增到圖形。它需要 x 和 y 軸的資料序列。
p.line(x, y, legend = "sine", line_width = 2)
最後,設定輸出檔案並呼叫 show() 函式。
output_file("sine.html")
show(p)
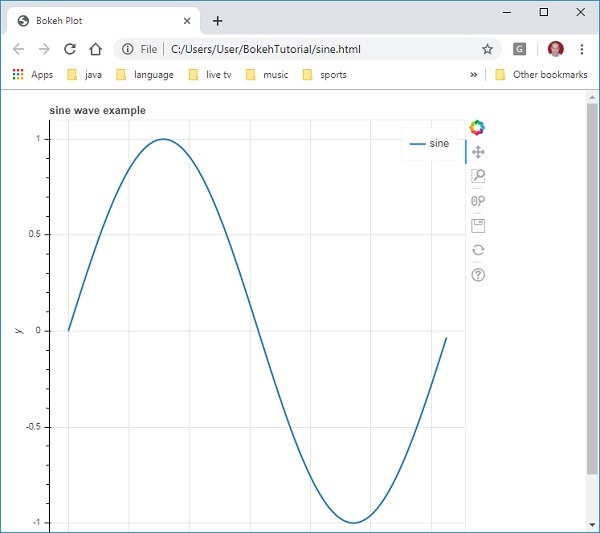
這將在“sine.html”中渲染折線圖並將其顯示在瀏覽器中。
完整的程式碼及其輸出如下
from bokeh.plotting import figure, output_file, show
import numpy as np
import math
x = np.arange(0, math.pi*2, 0.05)
y = np.sin(x)
output_file("sine.html")
p = figure(title = "sine wave example", x_axis_label = 'x', y_axis_label = 'y')
p.line(x, y, legend = "sine", line_width = 2)
show(p)
瀏覽器輸出
廣告
© .
All rights reserved.